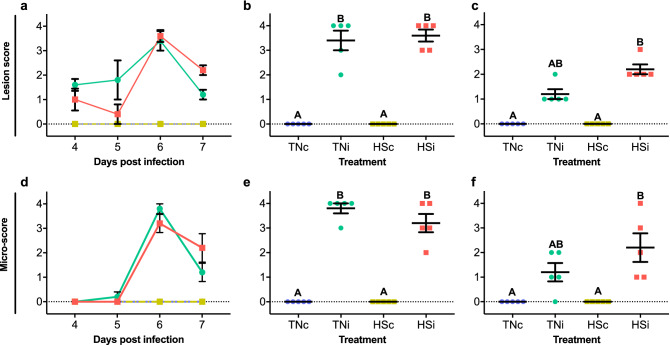
Figure 2.
Lesion scores from 4 to 7 dpi (a), at 6 dpi (b) and 7 dpi (c). Microscopic scores from 4 to 7 dpi (d), at 6 dpi (e) and 7 dpi (f). of chickens infected with E. maxima and housed at thermoneutral (TNi; green) or heat stress (HSi; red) environment, as compared to uninfected chickens housed at thermoneutral (TNc; blue) or heat stress (HSc; yellow) environments, assessed from 4 to 6 dpi. Mean and standard error of the mean (SEM) are depicted. Data were analyzed by Kruskal–Wallis test. All tests were performed at 5% level of significance (p < 0.05). Significant differences between the groups are indicated by different superscript letters.

