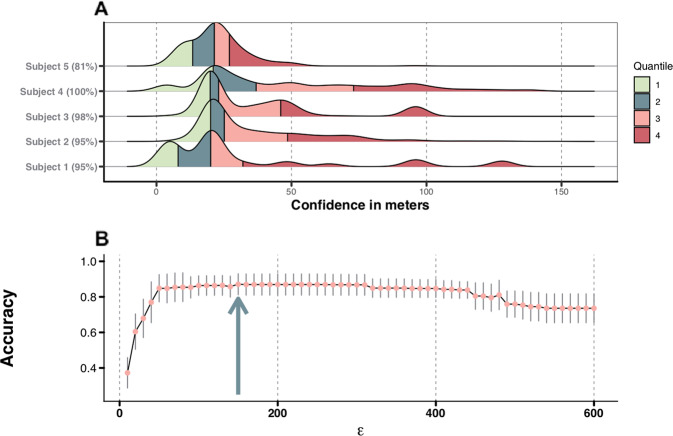
Fig. 2. Evaluation and optimization preprocessing procedures.
a Accuracy of the geospatial coordinates for each participant represented by the confidence in meters (colored in 25% quantiles). The confidence of each geospatial coordinate is interpreted as the 68% probability that true location is within the distance in meters. b Adjusted Rand Index for each epsilon value combined with the standard error. The optimal value is 150m with an Adjusted Rand Index of 0.87, this point is marked by the arrowed line.

