Figure 3.
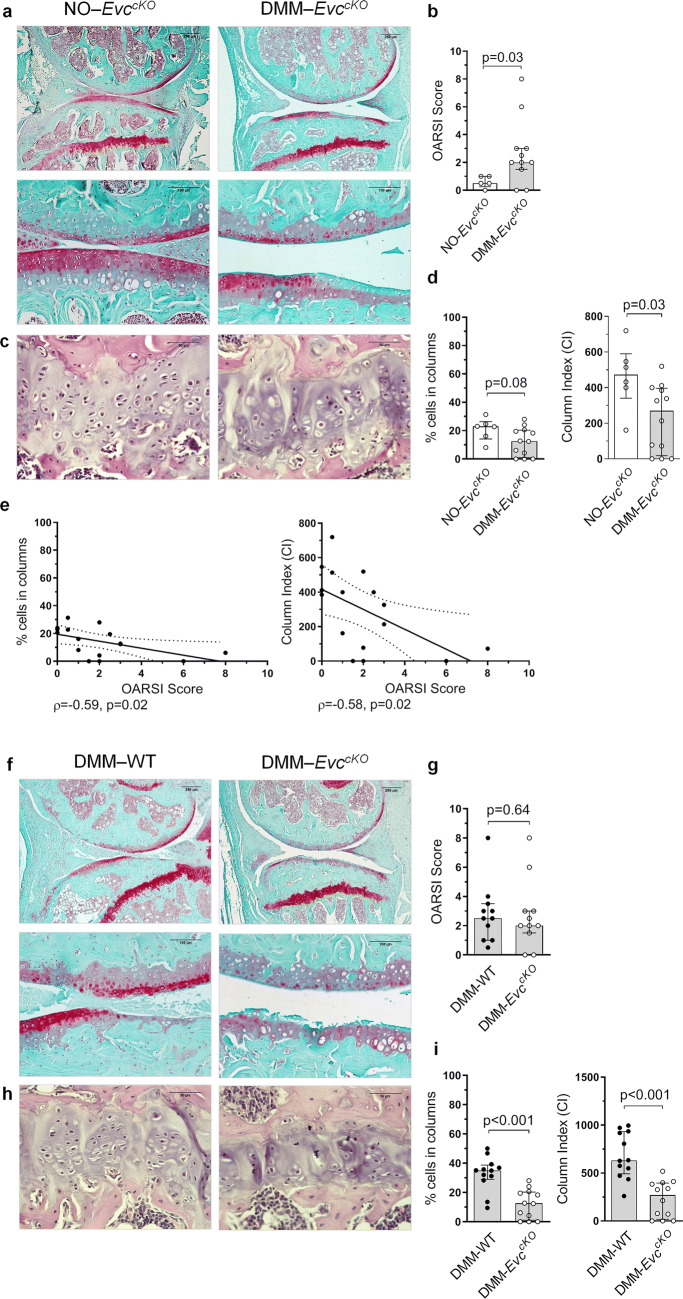
Effect of GP chondrocyte disarrangement on articular cartilage (AC) (a) Representative Safranin-O Fast Green stained mice joint sections at × 5 and × 20 magnification in NO-EvccKO and DMM-EvccKO mice (bars = 250 and 100 µm respectively). (b) Histopathological OARSI Score represented as the sum of tibia and femur scores in NO-EvccKO and DMM-EvccKO mice. (c) Representative Haematoxilin-Eosin stained tibia growth plate (GP) sections at × 40 magnification in NO-EvccKO and DMM-EvccKO mice (bars = 50 µm). (d) Percentage of cells in columns and column index (CI) in the GP in NO-EvccKO and DMM-EvccKO mice. (e) Association between the percentage of cells in columns and OARSI score, and between CI and OARSI score in EvccKO mice. (f) Representative Safranin-O Fast Green stained mice joint sections at × 5 and × 20 magnification in DMM-WT and DMM-EvccKO mice (bars = 250 and 100 µm respectively). (g) Histopathological OARSI Score represented as the sum of tibia and femur scores in DMM-WT and DMM-EvccKO mice. (h) Representative Haematoxilin-Eosin stained tibia GP sections at × 40 magnification in DMM-WT and DMM-EvccKO mice (bars = 50 µm). (i) Percentage of cells in columns and CI in the GP in DMM-WT and DMM-EvccKO mice. Data are shown as median ± interquartile range (IQR). NO-WT, n = 10–16; DMM-WT, n = 11–12; NO-EvccKO, n = 5–6; DMM-EvccKO, n = 11–12.

