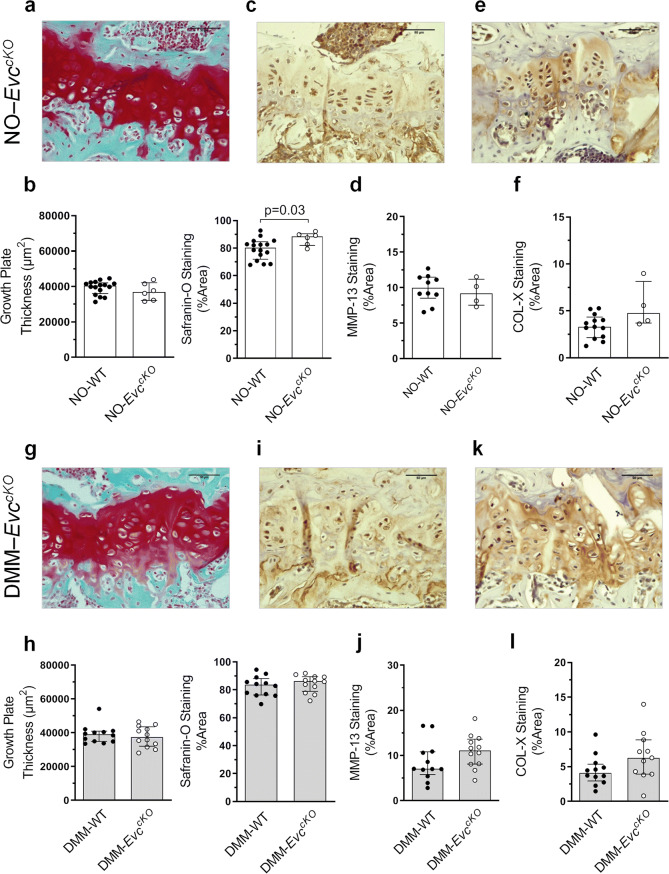
Figure 5.
Evaluation of the growth plate (GP) pathological state in EvccKO mice. (a) Representative Safranin-O Fast Green stained tibia GP sections at × 40 magnification in NO-EvccKO mice (bars = 50 µm). (b) Comparison of GP thickness and Safranin-O staining quantification in NO-WT and NO-EvccKO mice. (c) Representative MMP-13 immunohistochemistry of NO-EvccKO GP samples (bars = 50 µm). (d) Comparison of MMP-13 staining quantification in NO-WT and NO-EvccKO mice. (e) Representative COL-X immunohistochemistry of NO-EvccKO GP samples (bars = 50 µm). (f) Comparison of COL-X staining quantification in NO-WT and NO-EvccKO mice. (g) Representative Safranin-O Fast Green stained tibia GP sections at × 40 magnification in DMM-EvccKO mice (bars = 50 µm). (h) Comparison of GP thickness and Safranin-O staining quantification in DMM-WT and DMM-EvccKO mice. (i) Representative MMP-13 immunohistochemistry of DMM-EvccKO GP samples (bars = 50 µm). (j) Comparison of MMP-13 staining quantification in DMM-WT and DMM-EvccKO mice. (k) Representative COL-X immunohistochemistry of DMM-EvccKO GP samples (bars = 50 µm). (l) Comparison of COL-X staining quantification in DMM-WT and DMM-EvccKO mice. Data are shown as median ± interquartile range (IQR). NO-WT, n = 10–16; DMM-WT, n = 12; NO-EvccKO, n = 4–6; DMM-EvccKO, n = 11–12.

