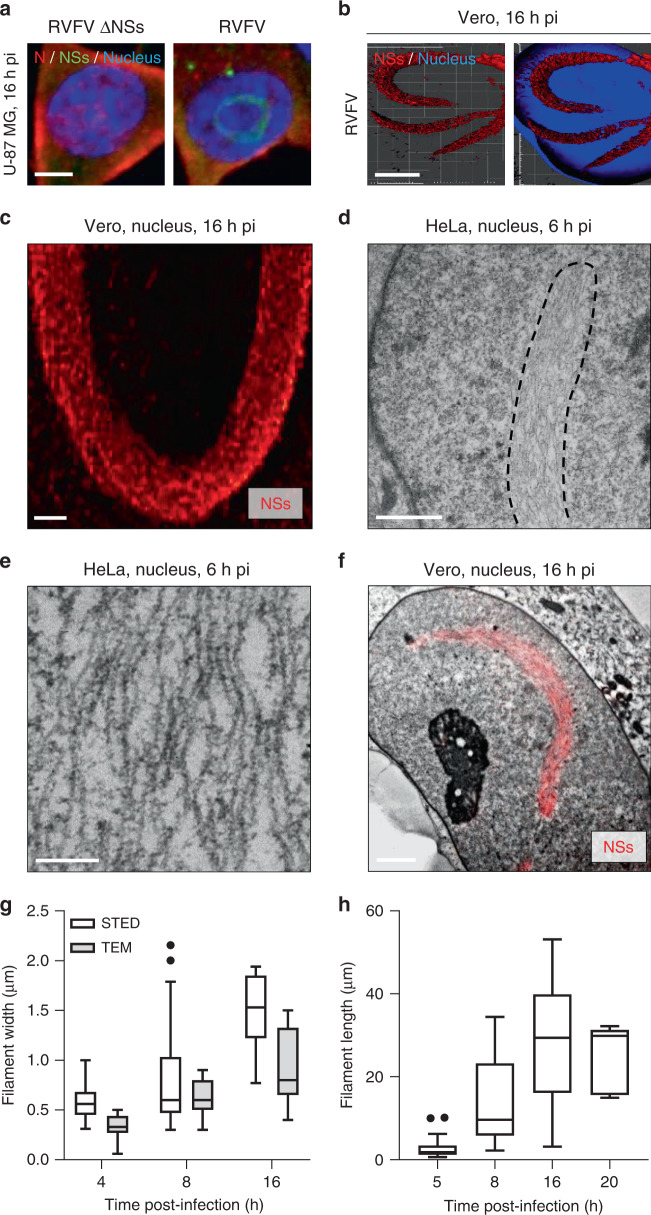
Fig. 1. Nuclear NSs filaments are bundles of many individual thin fibrils.
a Human U-87 MG cells were exposed to Rift Valley fever virus strain ZH548 (RVFV) or its counterpart devoid of the NSs sequence (RVFV ΔNSs), both at MOI ~5. Infected cells were imaged by confocal microscopy after labeling of nuclei with Hoechst (blue) and immunofluorescence staining of the RVFV proteins NSs (green) and N (red). Images are representative of three independent experiments. Scale bar, 5 µm; pi post-infection. b Green monkey Vero cells were infected with RVFV at a MOI of 5 for 16 h. Samples were then stained with Hoechst and antibodies (Abs) against intracellular NSs and imaged by super-resolution stimulated emission depletion (STED) microscopy. 3D-reconstruction of STED Z-stacks was achieved with IMARIS software and shows nuclear NSs filaments in red and the nuclei of infected cells in blue. Experiments were repeated independently three times with similar results. Scale bar, 5 µm. c High magnification STED microscopy image of a nuclear NSs filament (red). Results are representative of three independent experiments. Scale bar, 1 µm. d Transmission electron microscopy (TEM) of nuclear NSs fibrillary aggregates. Human HeLa cells were infected with RVFV (MOI ~5) and examined in thin sections 6 h pi. The black dashed line outlines one NSs fibrillary aggregate. Images are representative of five independent experiments. Scale bar, 1 µm. e High magnification TEM image of nuclear NSs filaments in HeLa cells. Note that filaments are bundles composed of many nonbranched, roughly parallel individual fibrils. Results are representative of five independent experiments. Scale bar, 200 nm. f Correlative light and electron microscopy (CLEM) images of nuclear NSs fibrillary aggregates. Vero cells were exposed to RVFV (MOI ~5) and examined in thin sections 16 h pi after immunofluorescence staining against NSs (red). The EM picture shown here was stitched from seven single electron micrographs at 12,500-fold magnification. Experiments were repeated independently three times with similar results. Scale bar, 2 µm. g Electron micrographs and STED images of infected Vero cells were analyzed for the width of nuclear NSs filaments. n = 19, 30, and 7 cells and n = 11, 7, and 10 cells were examined by TEM and STED microscopy at 4, 8, and 16 h pi, respectively. Center line, median; box limits, upper and lower quartiles; whiskers, 1.5× interquartile range; points, outliers. h Vero cells were exposed to RVFV for up to 20 h and immuno-stained against NSs prior STED microscopy analysis. Images were quantified with the deep learning-based ilastik software. The length of NSs filaments was measured as described in Supplementary Fig. 2. n = 19, 30, 11, and 5 cells were examined at 5, 8, 16, and 20 h pi, respectively. Center line, median; box limits, upper and lower quartiles; whiskers, 1.5× interquartile range; points, outliers.

