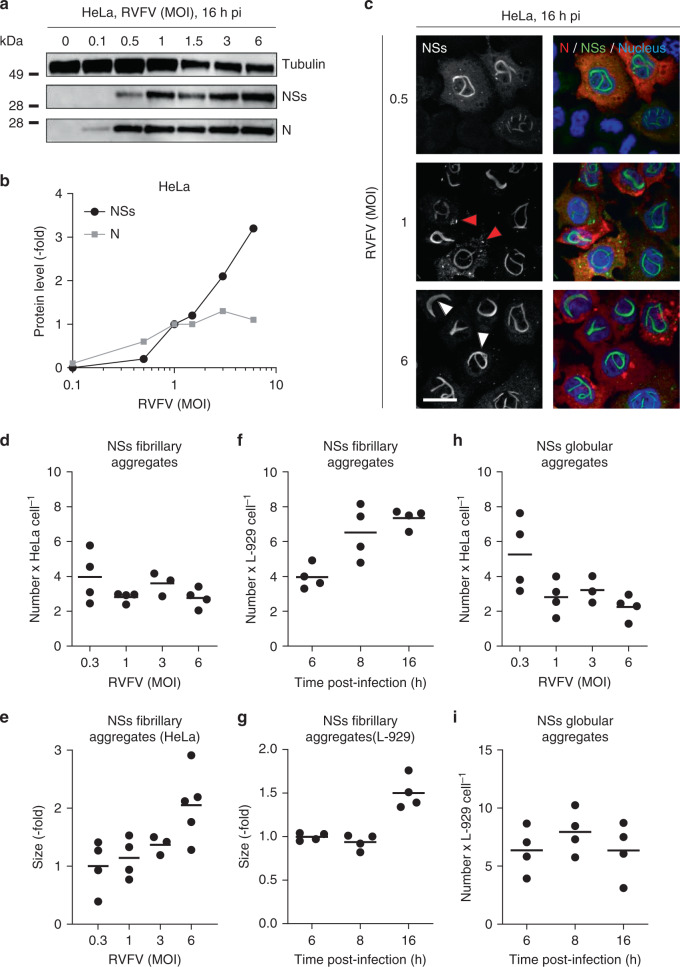
Fig. 4. NSs aggregates grow in an amyloid fashion.
a HeLa cells were infected at various MOIs of RVFV for 16 h and assayed for the viral N and NSs proteins by western blot (WB) after 2%-lithium dodecyl sulfate treatment and boiling. b Shows the semi-quantification of the N and NSs expression obtained from WB analysis as shown in a. N and NSs protein levels are expressed as the fold increase relative to their respective level in cells infected at a MOI of one and normalized to the level of tubulin. Experiments were repeated independently three times with similar results. c HeLa cells were exposed to RVFV at the indicated MOIs followed by immunofluorescence staining against N (red) and NSs (green) 16 h later. Nuclei were stained with Hoechst (blue) before confocal microscopy imaging. White and red arrowheads indicate NSs filamentous and globular aggregates, respectively. Images are representative of three independent experiments. Scale bar, 20 µm. d, h Confocal Z-stack obtained in c were classified, segmented, and analyzed with the software ilastik (Supplementary Fig. 2). The number of fibrillary (d) and globular (h) aggregates is given per positive cell for MOIs ranging from 0.3 to 6. Points represent independent experiments (n = 4, with the exception of MOI ~3, n = 3). Center line, mean. e Scatter dot plot depicting the size of NSs fibrillary aggregates in HeLa cells 16 h pi according to the MOI. The size is expressed as the fold increase relative to the average size in cells infected at a MOI of 0.3. Points represent independent experiments (n = 4, with the exception of MOI ~3, n = 3, and MOI ~6, n = 5). Center line, mean. f, g, i L-929 murine cells were infected with RVFV (MOI ~3) for up to 16 h, immuno-stained against the viral proteins N and NSs. Infected cells were analyzed for the number (f, i) and size (g) of aggregates in NSs-positive cells over 16 h as described in Supplementary Fig. 2. The size in G is expressed as the fold increase relative to the average size measured 6 h pi. Points represent independent experiments (n = 4). Center line, mean.

