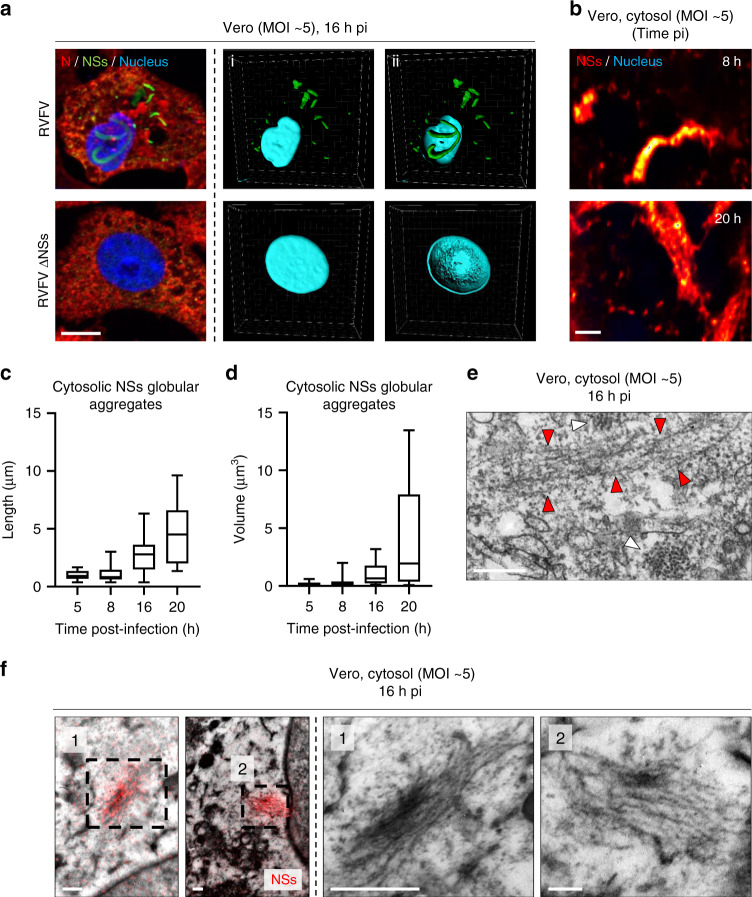
Fig. 6. NSs assembles into short cytosolic amyloid-looking fibrillary aggregates.
a Vero cells were infected for 16 h with RVFV or RVFV ΔNSs, both at a MOI of 5. Infected cells were imaged by confocal microscopy after labeling of nuclei with Hoechst (blue) and immunofluorescence staining of intracellular RVFV proteins N (red) and NSs (green). The left panel shows Z-stack projections whereas the three others are 3D-reconstructions obtained with IMARIS software and displaying (i) cytosolic NSs and (ii) nuclear NSs. Results are representative of three independent experiments. Scale bar, 10 µm. b Vero cells were infected with RVFV for 8 and 20 h and subjected to immunofluorescence staining against NSs. Cytosolic NSs aggregates (red/yellow) and nuclei (blue) were imaged by STED microscopy. Images are representative of independent experiments. Scale bar, 1 µm. c, d Vero cells were exposed to RVFV (MOI ~5) for up to 20 h. The length (c) and volume (d) of cytosolic NSs globular aggregates was measured as described in Fig. 1h. n = 13, 41, 21, and 11 cytosolic NSs globular aggregates were examined at 5, 8, 16, and 20 h pi, respectively. Center line, median; box limits, upper and lower quartiles; whiskers, min. to max. range. e Vero cells were exposed to RVFV and imaged by TEM 16 h later. White and red arrowheads indicate cross- and longitudinal-sections of fibrils in the cytosol, respectively. Images are representative of three independent experiments. Scale bar, 200 nm. f Cytosolic aggregates imaged by CLEM following immunofluorescence staining against NSs (red). Fiber-arrays overlaid with the red fluorescence channel. Higher magnifications of cytosolic aggregates consisting of thin, short NSs fibrils are shown (black numbers and dashed squares). Experiments were repeated independently thrice with similar results. Scale bars, 250 nm.

