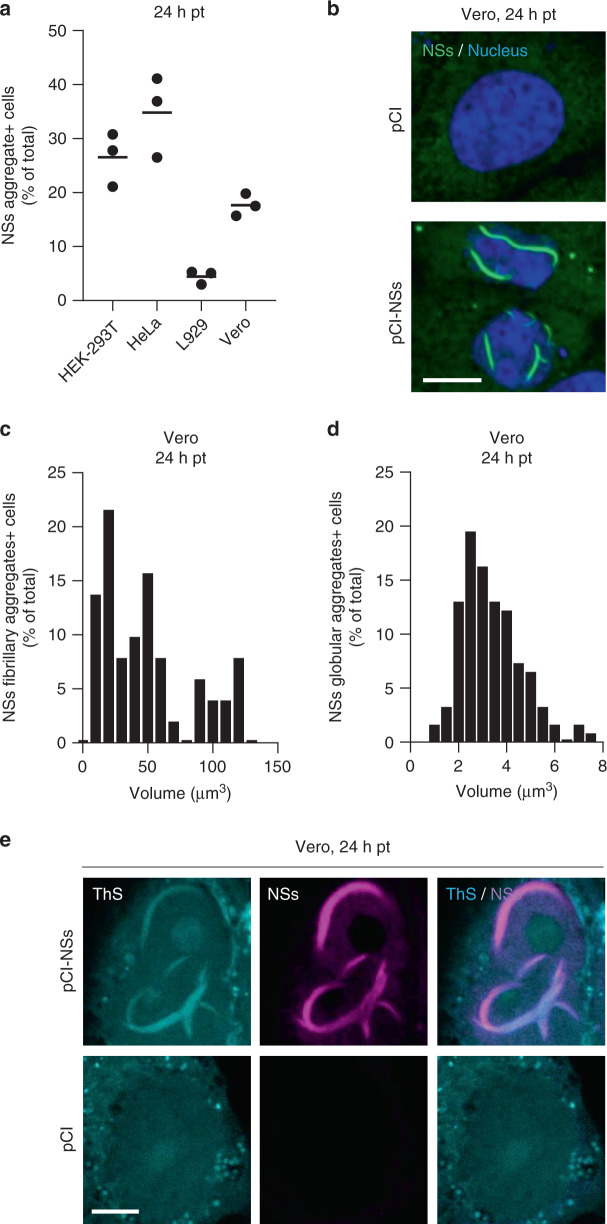
Fig. 7. NSs expressed from plasmid DNAs forms nuclear and cytosolic aggregates.
a Various cell lines were transfected with the plasmid vector pCI encoding NSs. Cells were fixed 24 h post-transfection (pt), immuno-stained against NSs, and imaged by fluorescence microscopy. Images were analyzed for the percentage of total cells positive for NSs aggregates. Points represent independent experiments (n = 3). Center line, mean. b shows confocal images of transfected Vero cells with nuclei in blue and NSs in green. Images are representative of three independent experiments. Scale bar, 10 µm. c, d Transfected Vero cells were analyzed for the size distribution of NSs fibrillary (c, n = 52) and globular (d, n = 164) aggregates as described in Supplementary Fig. 2. e Transfected Vero cells were permeabilized with a Triton X-100-based buffer and then stained with the amyloid-binding dye ThS (blue) and Abs against NSs (purple) before confocal imaging. Experiments were repeated independently thrice with similar results. Scale bar, 5 µm.

