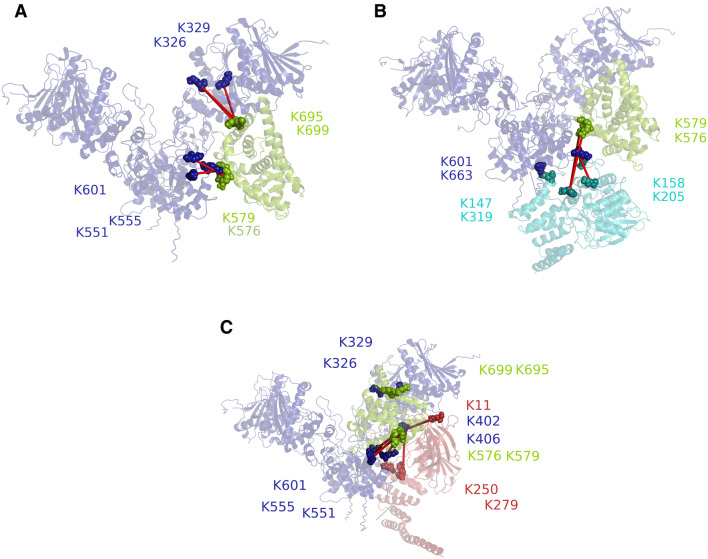
Figure 7.
Structural representation of HSP-90 complexes, generated by crosslink guided molecular docking. (A) Structural representation of the binary GR-LBDm·HSP-90 complex. HSP-90 is shown in blue, GRLBD in green and spheres represent the crosslinked lysine residues. (B) Structural representation of the trimeric GRLBD·HSP-90·PPH-5 complex. HSP-90 is shown in blue, GRLBD in green and PPH-5 in cyan. (C) Structural representation of the trimeric GRLBD·HSP-90·FKB-6 complex. HSP-90 is shown in blue, GRLBD in green and FKB-6 in red.

