
Figure 3.
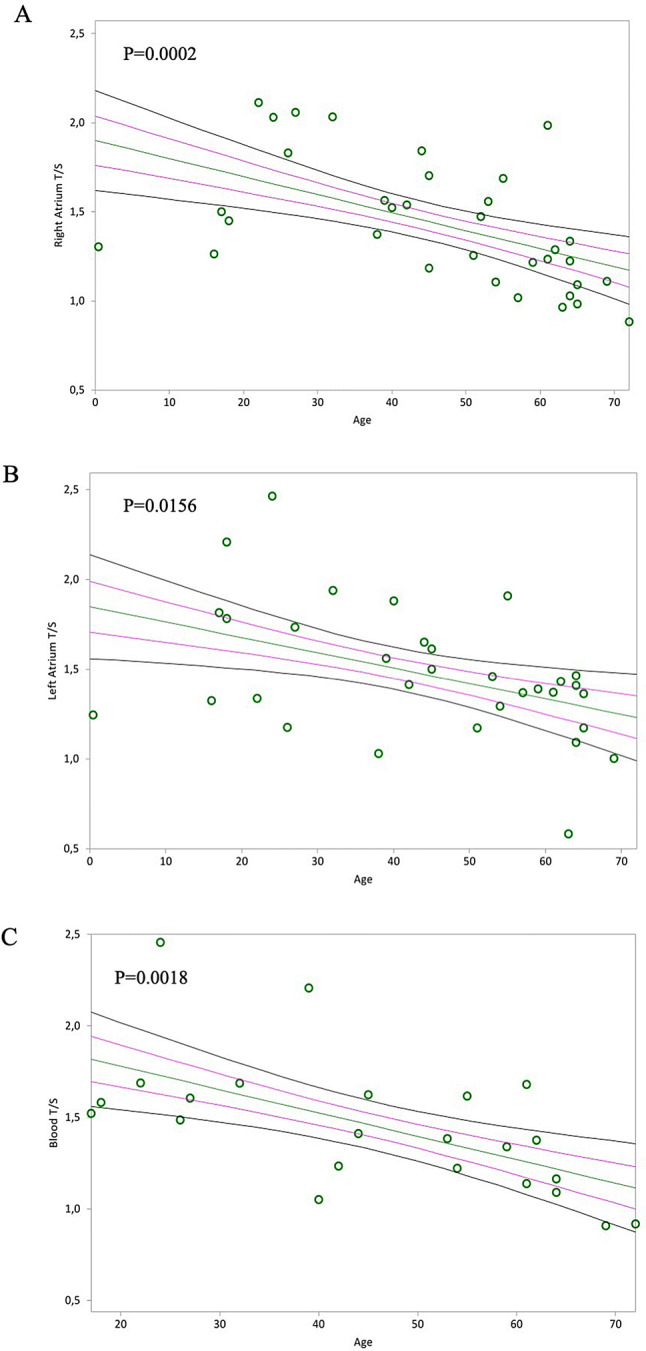
In (A) and (B), non-parametric linear regression plots showing correlation between telomere length (T/S) of the Right Atrium (RA) and the Left Atrium (LA) and donor chronological age (Kendall’s rank correlation coefficient tau b for RA = − 0.446, for LA = − 0.304). In (C), non-parametric linear regression plots showing the correlation between telomere length (T/S) of the circulating blood leucocytes (indicated as “blood T/S”) and the chronological age of the donors (Kendall’s rank correlation coefficient tau b = − 0.472). Mean, Standard Error (SE) and 95% coefficient intervals (CI) are represented as green, pink and black lines, respectively.