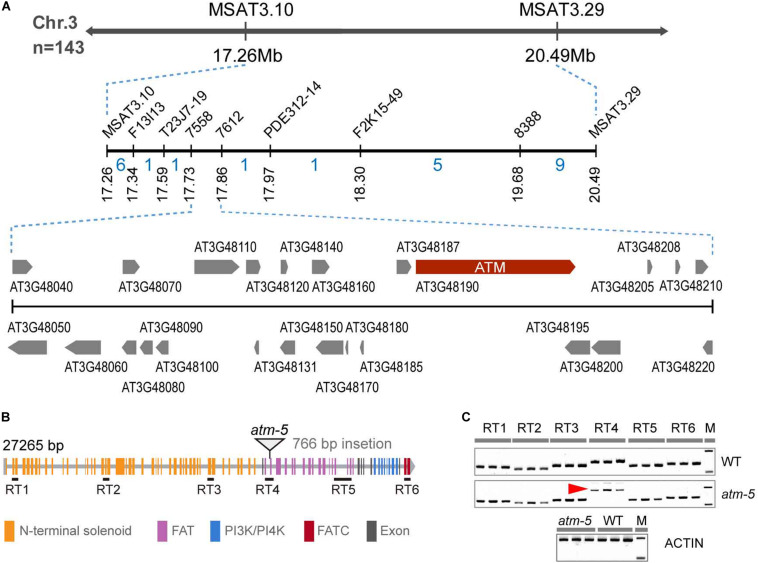
FIGURE 2.
Identification of the mutated gene in the mutant. (A) The fine-linkage map generated by analyzing 143 line 184 × Col-0 F2 segregating plants. The recombinant numbers are given between markers. (B) Diagram of ATM gene, the triangle showing the position of 766 bp insertion. All the colored rectangles represent an exon and each color indicates gene coding regions of corresponding protein domains. (C) RT-PCR detection of ATM transcripts. Six pairs of primers (30 cycles of PCR) were used to analyze the transcript and the location of these primer pairs was shown in (B). The red arrow indicated the abnormal transcription products of ATM detected in atm-5. Amplification of the ACTIN cDNA has been used as a control (25 cycles of PCR).

