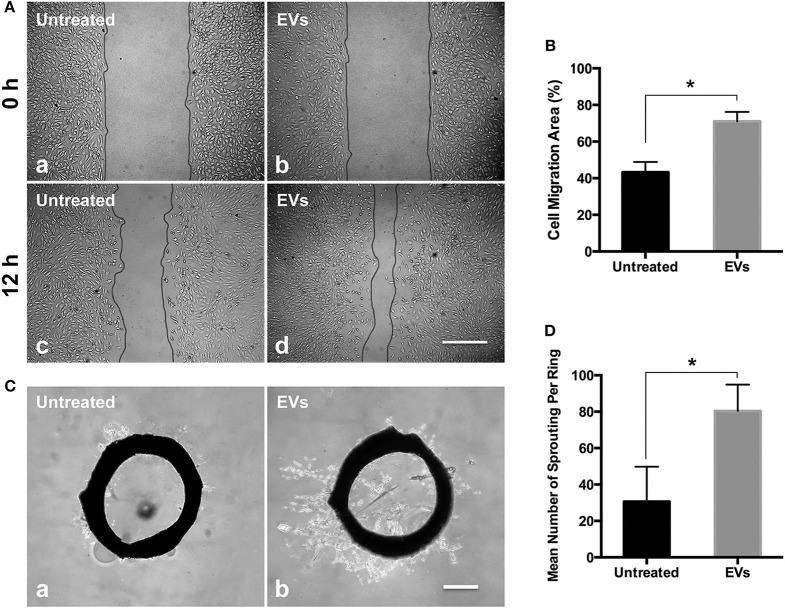
Figure 2.
Proangiogenic capacities of PMSC-EVs. (A) HUVEC migration treated with PMSC-EVs (b, d) or without PMSC-EVs (a, c). Scale bar = 100 μm. (B) Quantification of HUVEC migration area. Data were expressed as mean ± standard deviation: *p < 0.05 (n = 3). (C) Rat aortic ring assay treated with PMSC-EVs (b) or without PMSC-EVs (a). Scale bar = 500 μm. (D) Quantification of the number of sprouting per ring. Data were expressed as mean ± standard deviation: *p < 0.05 (n = 3).

