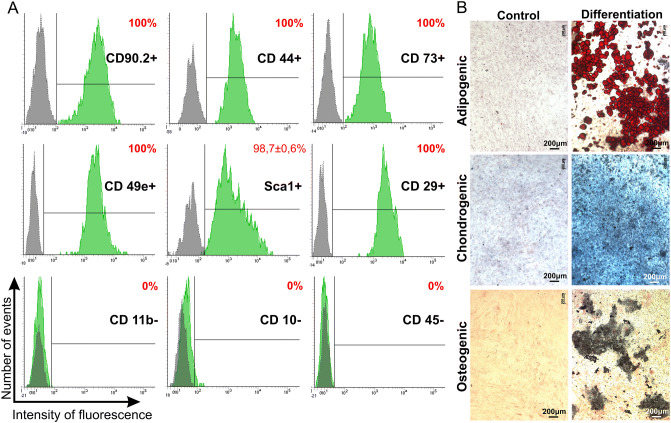
Figure 2.
Phenotypic analysis of murine MSCs. (A) Flow cytometry analysis. Histograms were generated using FACSDiva7 software. Grey—negative control; Green—cells labeled with fluorescence labeled antibodies. (B) MSC differentiation into the adipogenic, chondrogenic and osteogenic lineages. Differentiation was revealed by following stainings: adipogenic differentiation—with Oil Red dye, chondrogenic differentiation—alcian blue, osteogenic—silver nitrate staining. Images were captured using ZEISS Axio Observer Z1 microscope.

