Figure 8.
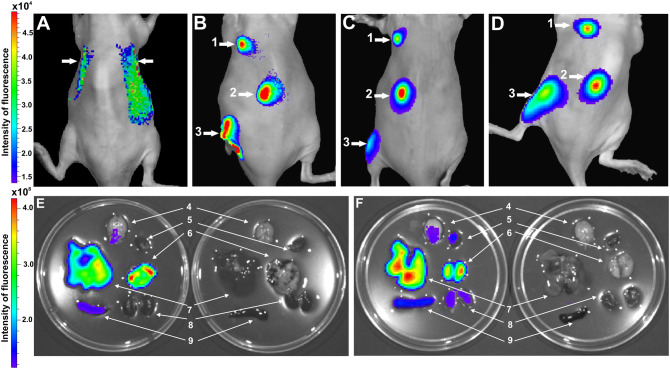
Analysis of CIMVs-MSCs distribution in vivo (A–D) and ex vivo (E,F). Biodistribution of CIMVs-MSCs after i.v. injection (A), s.c. injection (B–D) and i.m. injection (B–D). (A) 1 h after i.v. injection; (B) 1 h after s.c. and i.m. injection; (C) 48 h after s.c. and i.m. injection; (D) 14 days after s.c. injection; and i.m. injection; (E) organs were collected one hour after i.v. injection of CIMVs-MSCs (experiment; left Petri dish) or PBS (control; right Petri dish); (F) organs were collected 48 h after i.v. injection of CIMVs-MSCs (experiment; left Petri dish) or PBS (control; right Petri dish). 1—s.c. injection 25 µg of CIMVs-MSCs; 2—s.c injection 50 µg of CIMVs-MSCs; 3—i.m. injection 50 µg of CIMVs-MSCs, 4—brain, 5—heart, 6—lung, 7—liver, 8—kidneys, 9—spleen. Images were captured using IVIS Imaging System.

