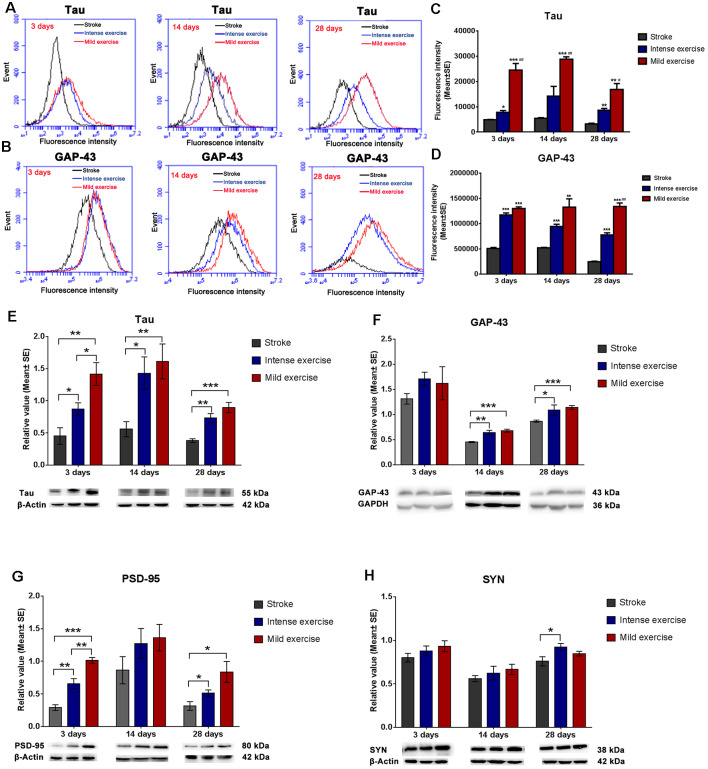
Figure 3.
Exercise-induced increased expression of synaptic proteins. (A–D) Representative images of Tau and GAP-43 detected by FCM. Both mild (A,C; 24,600.2 vs. 4,885.12 at 3 days, ***p < 0.001; 28,897 vs. 5,408.9 at 14 days, ***p < 0.001; 16,879.2 vs. 3,186.86 at 28 days, **p < 0.01) and intense (7,752.19 vs. 4,885.12 at 3 days, *p < 0.05; 14,230.5 vs. 5,408.9 at 14 days; 8,698.12 vs. 3,186.86 at 28 days, **p < 0.01) exercise significantly induced Tau expression at 3, 14, and 28 days. Further increases in expression were seen in mildly exercised rats at 3, 14, and 28 days (#0.05, ##0.01, ###0.001 represent mild exercise vs. intense exercise). The same results were also seen for GAP-43 expression (B,D). (E–H) Representative images of Tau, GAP-43, PSD-95, and SYN as detected by Western Blot. Compared to the control group, levels of Tau (E; 1.4 vs. 0.5 at 3 days, **p < 0.01; 1.6 vs. 0.6 at 14 days, **p < 0.01; 0.9 vs. 0.4 at 28 days, ***p < 0.001), GAP-43 (F; 1.6 vs. 1.3 at 3 days; 0.7 vs. 0.5 at 14 days, ***p < 0.001; 1.1 vs. 0.8 at 28 days, ***p < 0.001), PSD-95 (G; 1.0 vs. 0.3 at 3 days, ***p < 0.001; 1.4 vs. 0.9 at 14 days; 0.8 vs. 0.3 at 28 days, *p < 0.05), and SYN (H; 0.9 vs. 0.8 at 3 days; 0.7 vs. 0.6 at 14 days; 0.8 vs. 0.8 at 28 days) in mildly exercised rats were increased. The same results were also seen with intense exercise. Levels of Tau (E; 1.4 vs. 0.9 at 3 days, *p < 0.05; 1.6 vs. 1.4 at 14 days; 0.9 vs. 0.7 at 28 days), GAP-43 (F; 1.6 vs. 1.7 at 3 days; 0.7 vs. 0.6 at 14 days; 1.1 vs. 1.0 at 28 days), PSD-95 (G; 1.0 vs. 0.7 at 3 days, **p < 0.01; 1.4 vs. 1.3 at 14 days; 0.8 vs. 0.5 at 28 days), and SYN (H; 0.9 vs. 0.9 at 3 days; 0.7 vs. 0.6 at 14 days; 0.8 vs. 0.9 at 28 days) were similar between mildly and intensely exercised rats.

