
FIGURE 1.
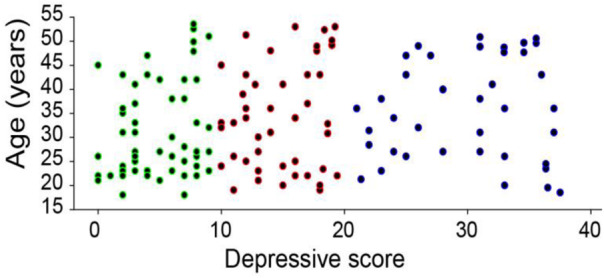
The distribution of the subjects and their scores in Hamilton Depression Scale. The control group scored less than 10, while the sub-threshold group scored higher than 10, and the MDD group scored higher than 20. The average age for control was 32.3 ± 8.9 (n = 59), sub-threshold group was 35.3 ± 8.6 (n = 48), and MDD group was 34.3 ± 7.8 (n = 43). And the mean score from Hamilton was 4.44 ± 2.6, 14.5 ± 3.5, 28.1 ± 5.4 for the three groups, respectively.