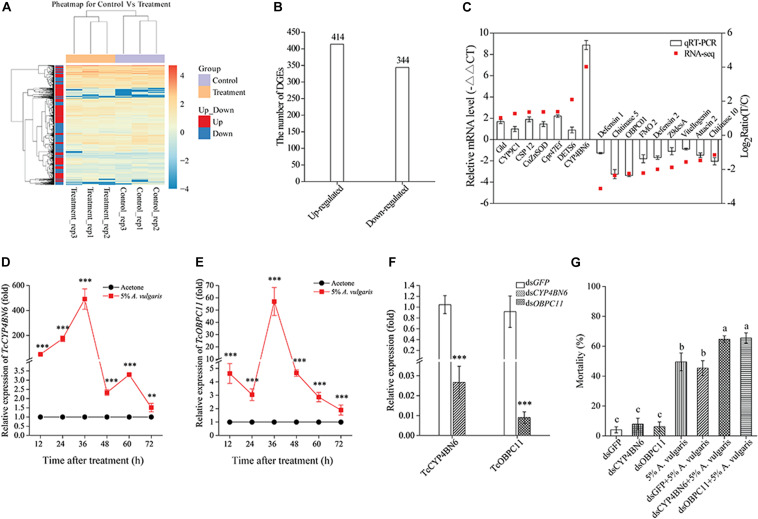
FIGURE 3.
(A) Heat map of 758 genes differentially expressed in larvae exposed to 5% A. vulgaris essential oil (EO) and control. Rows represent a single gene and columns are comparisons between genes in the exposure treatment and the control. The left-hand column clusters samples (N = 6) based on similarity of log10 transformed gene expression. Lighter colors indicate lower levels of differential expression. (B) Changes in the gene expression profile between the control and 5% A. vulgaris EO exposure groups. (C) A comparison of the expression profiles of the selected genes as determined by RNA-sequencing and qRT-PCR. OBP, Odorant binding protein; CYP, Cytochrome P450; Ugt, UDP-glucuronosyltransferase; EST, Esterase; GST, Glutathione S-transferase; MRP, Multidrug resistance protein; BG, Beta-glucuronidase; XDH, Xanthine dehydrogenase; FMO, Flavin-containing monooxygenase. Effects of 5% A. vulgaris EO exposure on the accumulation of TcCYP4BN6 (D) and TcOBPC11 (E) in 20-day-old larvae of T. castaneum. Acetone treatment represents the negative control group, which has been ascribed an arbitrary value of 1. The 12, 24, 36, 48, 60, and 72 h are six different test time points following EO treatment. (F) RNAi-mediated gene silencing. Twenty-day-old larvae were used for dsRNA injection. RNA was extracted and quantified by qRT-PCR at fifth day. Control beetles were injected with the same amount of green fluorescent protein (GFP) dsRNA. (G) Effect of TcCYP4BN6/TcOBPC11 silencing by injection of ds-TcCYP4BN6/ds-TcOBPC11 on toxicity of EO to 20-day-old larvae. Larvae injected with ds-TcCYP4BN6/ds-TcOBPC11/ds-GFP only served as untreated controls. Following injection with ds-TcCYP4BN6/ds-TcOBPC11/ds-GFP, larvae were treated with EO for 72 h. Data shown are mean ± SE (n = 3). An asterisk above bars indicated significant differences in the mRNA expression among the control and treatments (**P < 0.01, ***P < 0.001; Student’s t-test). Different letters above bars indicate significant differences (P < 0.05) according to LSD multiple comparison tests.

