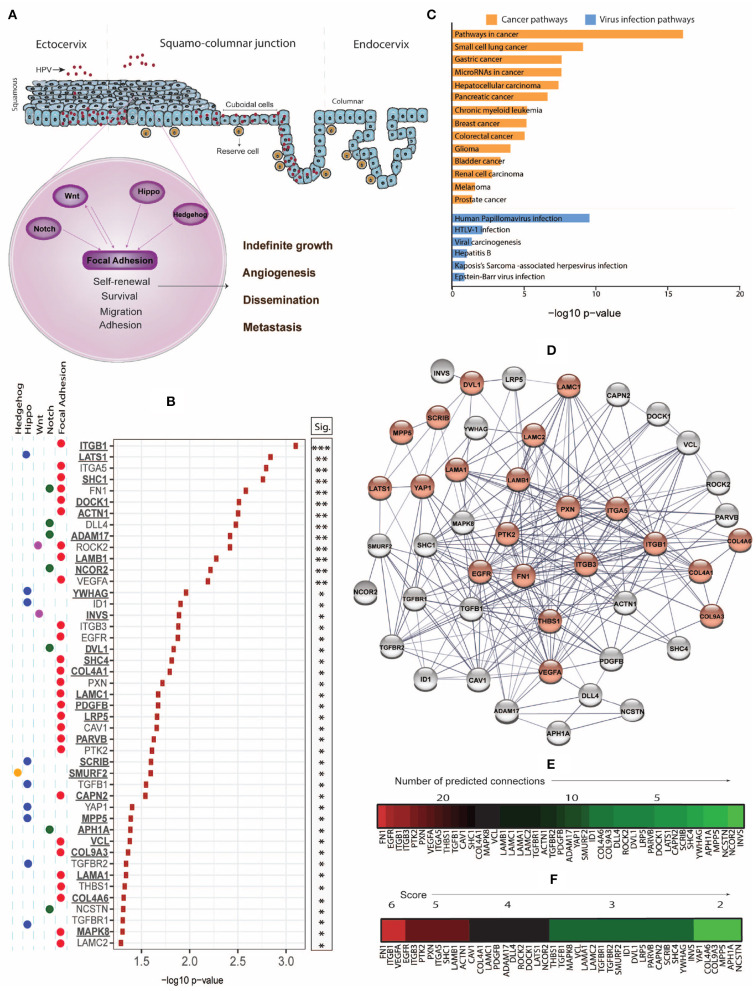
Figure 1.
(A) While the productive life cycle of HPV occurs in the squamous ectocervix, cervical intraepithelial neoplasia (CIN) and invasive cervical cancer dominantly arise from the squamo-columnar junction (SJL) of the cervix, which contains reserve and cuboidal cells with stem-like properties. Stemness-related pathways such as Focal Adhesion, Notch, Wnt, Hippo, and Hedgehog with cross-talk mechanisms facilitate cell survival, proliferation, epithelial mesenchymal transition, dissemination, and metastasis. (B) Using the Xenabrowser online portal (https://xenabrowser.net/) (Goldman et al., 2019), The Cancer Genome Atlas Cervical Squamous Cell Carcinoma and Endocervical Adenocarcinoma (TCGA-CESC) database was filtered on primary site samples (n = 304) and screened for significant association of high expression of stemness-related genes with poor 5-year (1,825 days) survival using Kaplan-Meier Plots, comparing subjects of the top and bottom 25% of gene expression. The web-based interactive Xenabrowser analysis integrates data of the following datasets: https://tcga.xenahubs.net/download/TCGA.CESC.sampleMap/HiSeqV2.gz (gene expression data), https://tcga.xenahubs.net/download/survival/CESC_survival.txt.gz (survival data) and https://tcga.xenahubs.net/download/TCGA.CESC.sampleMap/CESC_clinicalMatrix (clinical data). Input genes (n = 526) were selected from KEGG pathways (hsa04150, hsa04330, hsa04310, hsa04390, hsa04340). P-values of significantly (p < 0.05) associated genes where overexpression associated with poorer survival were –log10 transformed and plotted. Underlined genes are those not previously associated with cervical cancer prognosis. (C) Significant genes from (B) were analyzed for enriched cancer and viral infection pathways using Enrichr and the KEGG 2019 human database. P-values were –log10 transformed and plotted. (D) STRING-db analysis of genes from (B) was used to estimate protein-protein interaction networks and levels of connectivity. Genes enriched in the KEGG HPV infection pathway (hsa05165) are displayed in red. (E) Heat map of genes ordered based on highest to lowest connectivity estimated by STRING-db. (F) A combined score was established based on the sum of a connectivity score (1: 0–10 connections; 2: 11–20 connections; 3: 21–30 connections) and a p-value score (1: –log10 < 1.5; 2: –log10 = 1.5–2.0; 3: –log10 > 2.0), and displayed as heat map.

