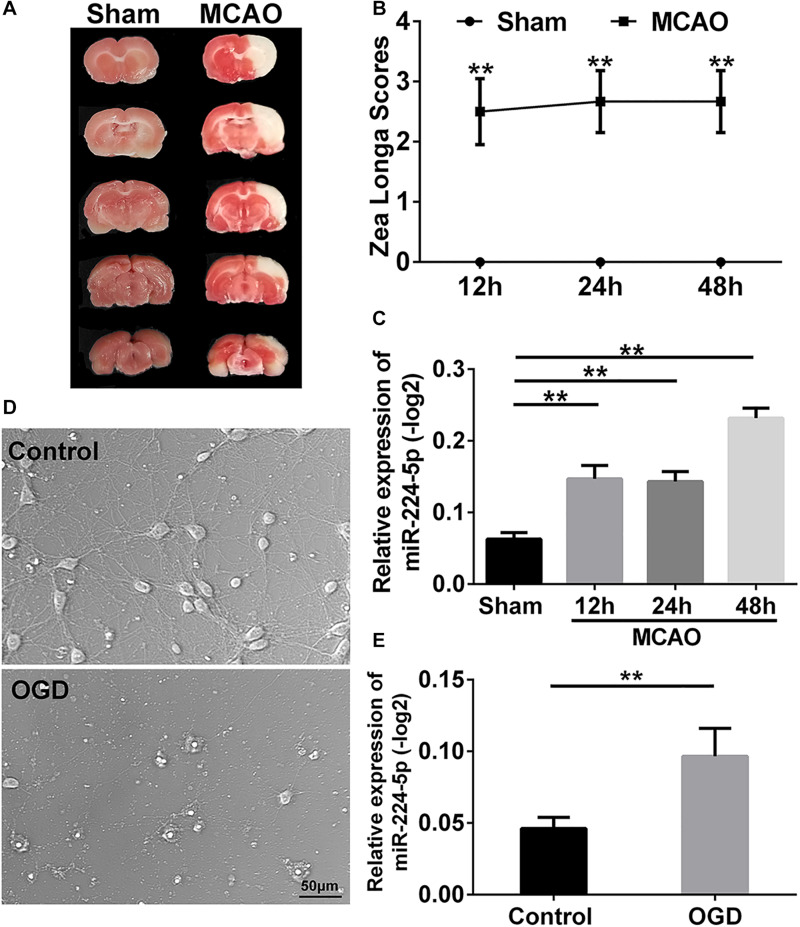
FIGURE 1.
MiR-224-5p increased in the cerebral cortex after MCAO and neurons after OGD. (A) TTC staining showed the cerebral infarction after MCAO. The white area was indicated as cerebral infarction. (B) The Zea Longa scores were significantly increased in 12th, 24th, and 48th hours after MCAO compared with the sham group in rats (∗∗P < 0.01). (C) The expression of miR-224-5p increased in 12th, 24th, and 48th hours in rats after MCAO (∗∗P < 0.01). (D) The bright field images of neurons after OGD. (E) The expression of miR-224-5p was significantly increased in neurons after OGD (∗∗P < 0.01).

