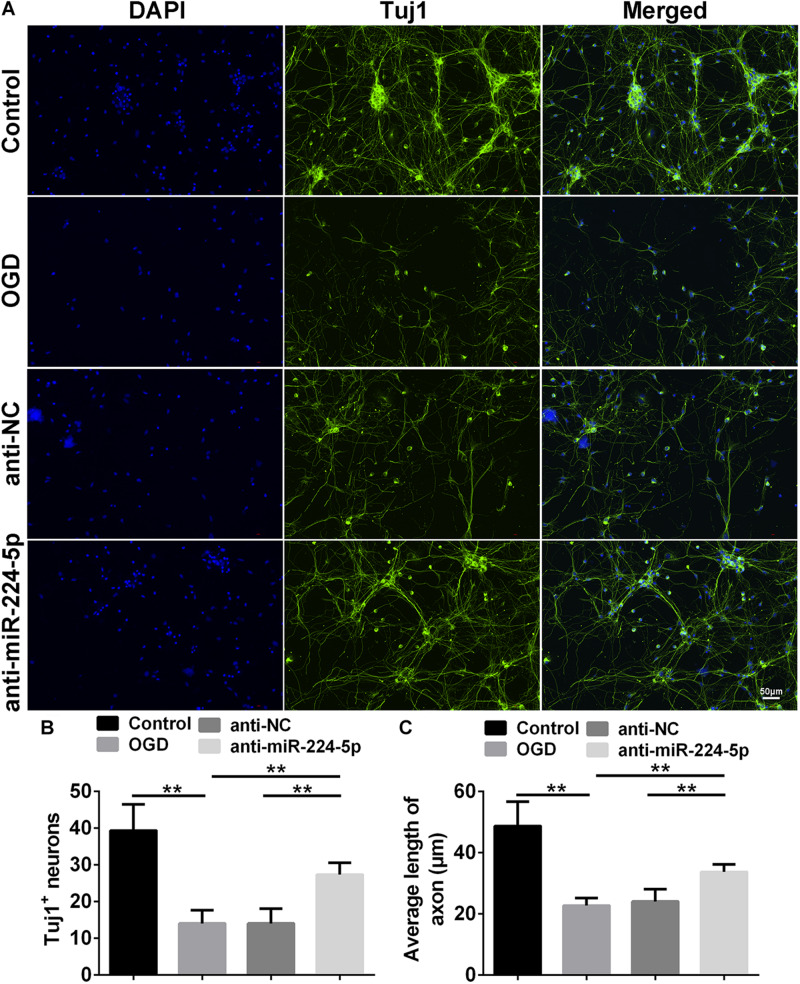
FIGURE 3.
Inhibition of MiR-224-5p Ameliorated Neurodegeneration. (A) Tuj1+ neurons (green) were observed in control group, OGD group, anti-NC group, and anti-miR-224-5p group. Nuclei were visualized by DAPI (blue). (B) The number of Tuj1+ neurons was quantified. The number of Tuj1+ cells was increased in the anti-miR-224-5p group compared with anti-NC (∗∗P < 0.01). (C) The neurite length was also quantified. The axonal length of neurons was increased in the anti-miR-224-5p group compared with anti-NC (∗∗P < 0.01).

