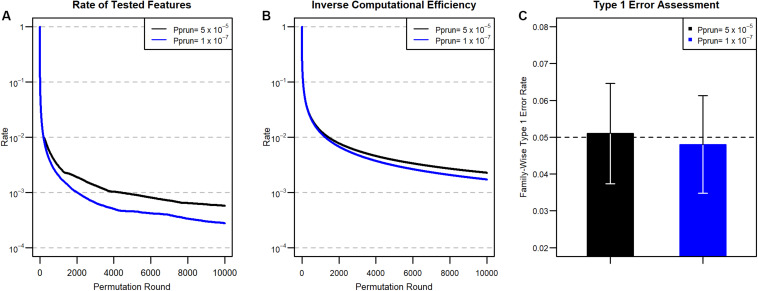
FIGURE 2.
(A) Proportion of tested features at each round after pruning for the two Pprun values in Figure 1. (B) Inverse of computational efficiency (ICE) for 2A. (C) Type 1 error results. We divided the number of false-positive features by 1,000 to obtain the family-wise type 1 error rate. 95% confidence intervals of the estimated type 1 errors are also provided.

