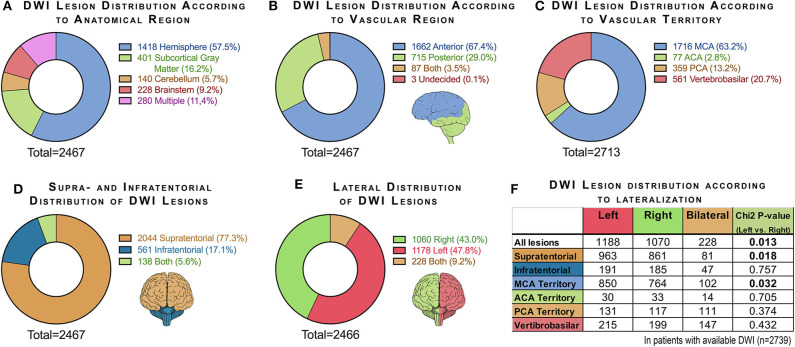
Figure 3.
Charts summarizing DWI lesion distribution according to (A) anatomical region, (B) vascular region, (C) vascular territory, (D) supratentorial and infratentorial location, and (E) lateralization. In chart (C), multiple infarcts were recorded once per vascular territory, and therefore the number of infarcts (2,713) exceeds the total number of patients with visible DWI lesions (2,467). Chart (F) shows the difference between right- and left-sided lesions for all lesions and specified for supratentorial and infratentorial lesions and specified for the major vascular territories [χ2 test after excluding patients with bilateral infarcts and with no infarcts (270 cases)].

