
Figure 5.
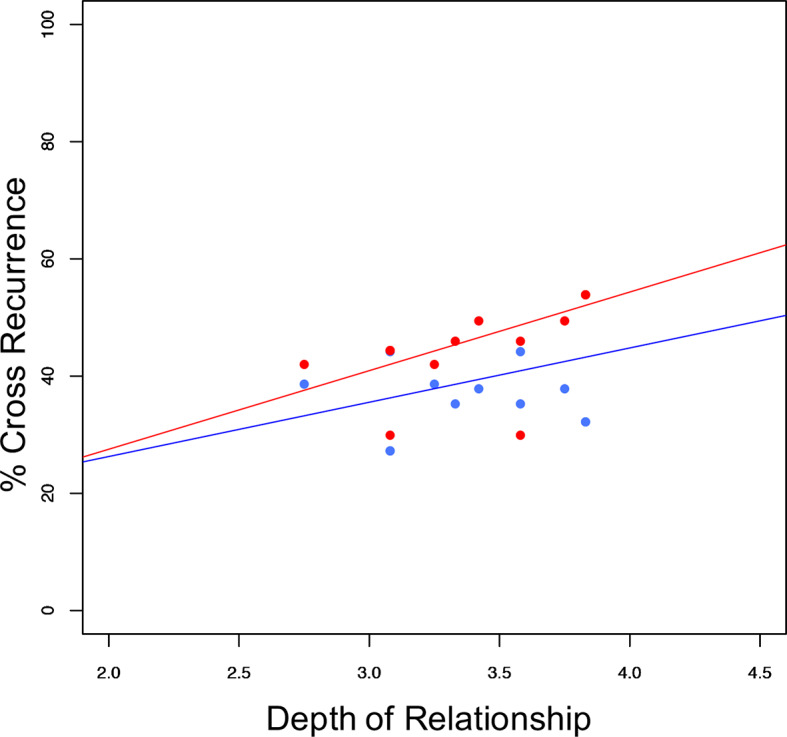
Sleep stage synchronization as a function of relationship depth. Distribution of synchronization (excluding wake) in relation to depth of relationship (couples' mean) and sleeping arrangement (co-sleep= red dots, individual sleep= blue dots) resulting in significant main effects of sleeping arrangement (F(1:10)= 6.585; p = 0.028), and relationship depth (F(1:10) = 5.976; p = 0.035) with no significant interaction (F(1:10) = 0.224; p = 0.646). Pearson's correlations of the respective sleeping arrangements are r = 0.45; p = 0.138 for individual sleep (blue line) and r = 0.52; p = 0.083 for co-sleep (red line) N = 12.