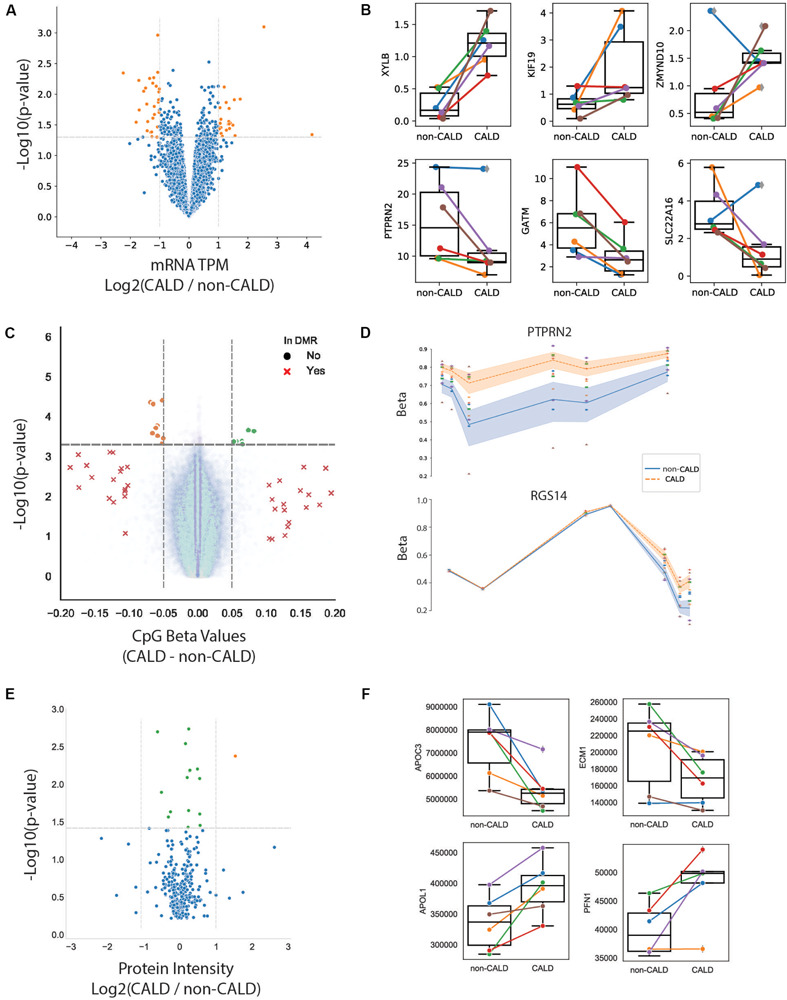
FIGURE 4.

Multi-omic analysis. (A) Volcano plot showing p-value and log2 fold change of gene expression from RNA-seq. Significant genes at p < 0.05 (orange dots), non-significant genes (blue dots). (B) Selected genes plotted as normalized RNA-seq values with boxplots for each group where each line/point is colored by family. (C) Volcano plot of DNA methylation over CpG probes from EPIC array, with non-significant (p > 0.05) DMR probes (blue dots), significant CpGs at the DMR level (red Xs), higher methylated non-CALD probes (orange dots), and higher methylated CALD probes (green dots). (D) DNAm over two significant DMRs within PTPRN2 and RGS14, points colored by family and lines colored by phenotype, with shading denoting inner quartile range. (E) Volcano plot of protein levels from LCMS with non-significant proteins (blue), significant proteins with log2 fold-change (CALD/non-CALD) of –1 to 1 (green), and log2 fold-change greater than 1 (orange). (F) Selected proteins which passed the p-value threshold of 0.05.
