
Figure 1.
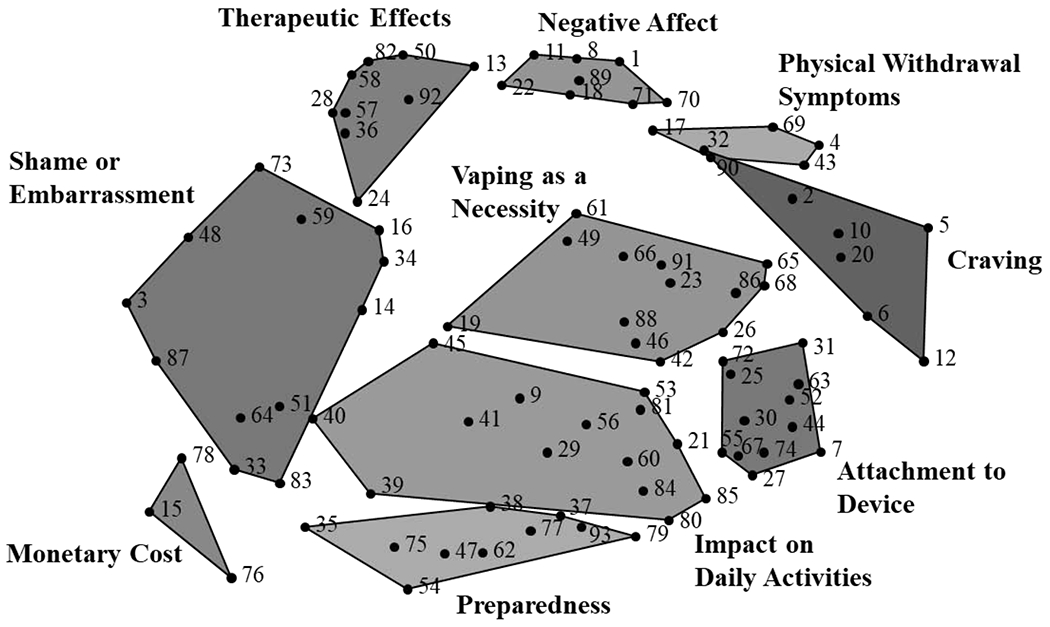
Concept map displaying 10 clusters ECIG user-identified statements describing indicators of ECIG addiction. Numbered points on the map that are closer to one another represent statements of more similar content whereas points on the map that are further apart represent statements of less similar content. Point numbers correspond to statements displayed in Table 2.