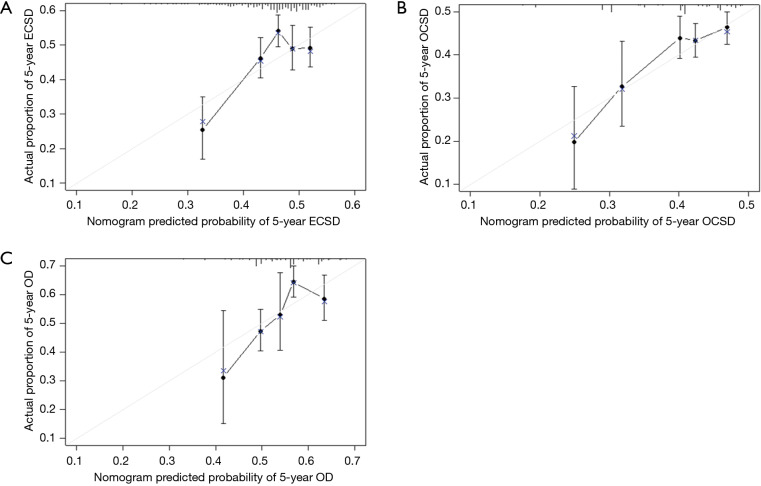
Figure 4.
Calibration curves for the nomogram. The x-axis represents the nomogram-predicted 5-year probabilities of ECSD (A), OCSD (B) and OD (C), and the y-axis represents the actual 5-year cumulative incidence of ECSD (A), OCSD (B) and OD (C). ECSD, oesophageal cancer-specific death; OCSD, other cause-specific death; OD, overall death.

