Figure 1.
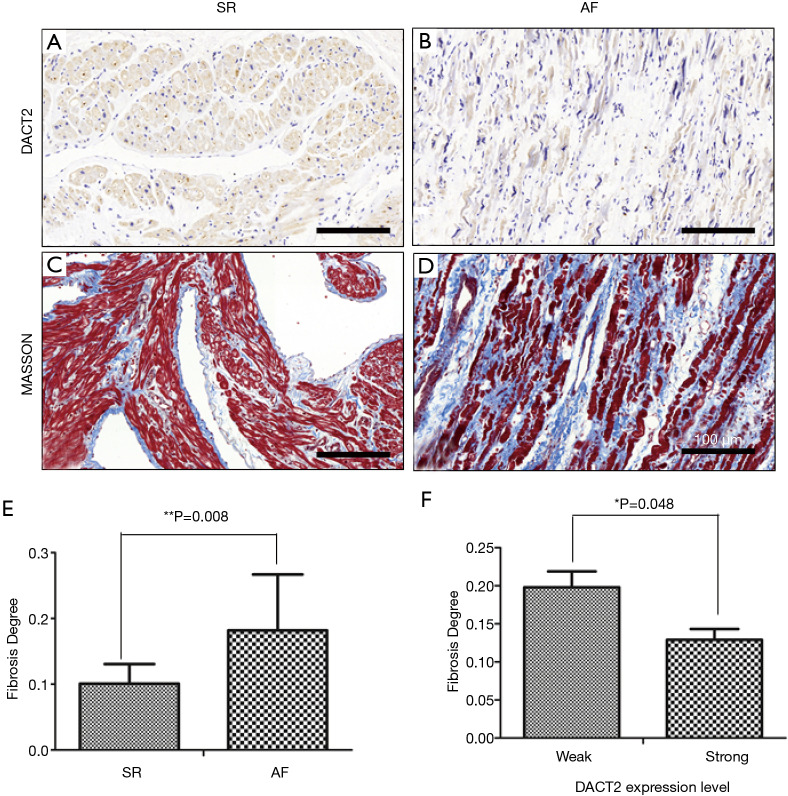
The expression pattern of DACT2 in the myocardial tissues of patients with valvular heart disease. (A,B) Immunohistochemistry evaluating DACT2 expression in the SR (A) and AF (B) groups. (C,D) Masson’s trichrome staining indicating fibrosis severity in the SR (C) and AF (D) groups. The sections indicated in A and C were obtained from the same SR patient, and the sections indicated in B and D were obtained from the same AF patient. Scale bars: 100 µm. (E) Fibrosis ratios of the AF and SR groups. (F) Fibrosis ratios of the weak and strong DACT2 expression groups. *, P≤0.05; **, P≤0.01. SR, sinus rhythm; AF, atrial fibrillation.

