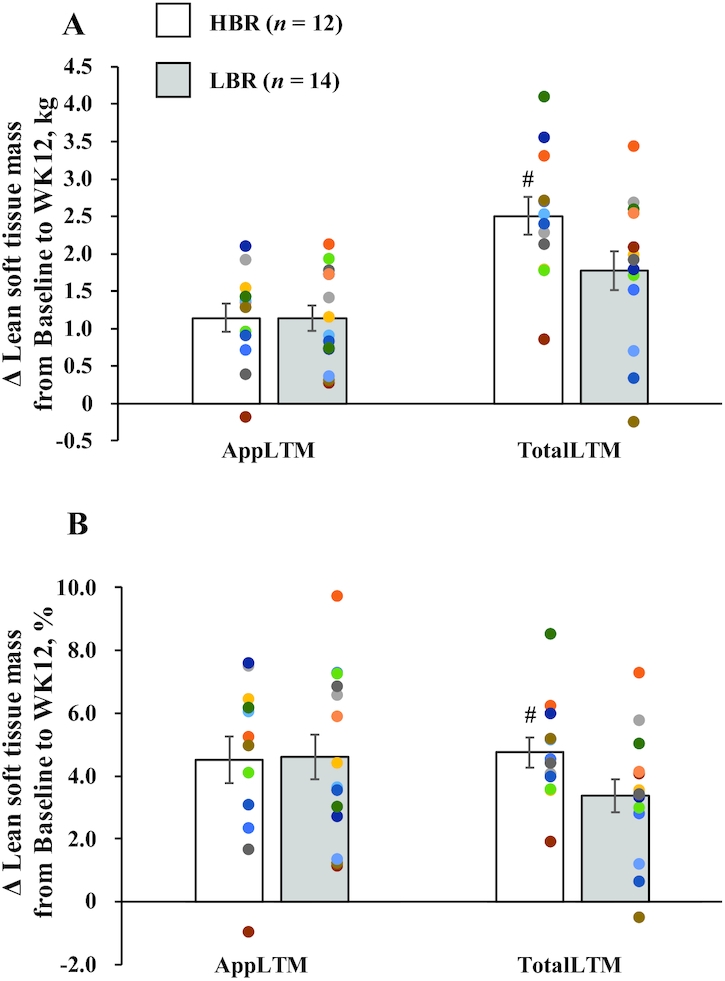
FIGURE 3.

Comparison of absolute change (A) and percentage change (B) in AppLTM and TotalLTM from baseline to week 12 in healthy young men with high or low relative protein intakes at breakfast. Values are indicated as means ± SEs, n = 12 (HBR) and n = 14 (LBR). Statistical analysis was performed with an independent t test to compare absolute and percentage changes from baseline to week 12 in AppLTM and TotalLTM between groups. Cohen d was used to express the effect size of comparisons (standard definitions: small, 0.3; medium, 0.5; large, 0.8; very large, 1.30). #Tended to differ from LBR, P = 0.056 (A: d = 0.795) or 0.067 (B: d = 0.760). The HBR (“high breakfast”) group consumed a protein-enriched meal at breakfast to achieve a protein intake >0.24 g/kg body weight, reported as the required protein intake at all 3 meals to maximize muscle protein synthesis (23). The LBR (“low breakfast”) group consumed a provided meal at breakfast to achieve a protein intake >0.24 g/kg body weight at only 2 meals (lunch and dinner). AppLTM, appendicular lean soft tissue mass; TotalLTM, total lean soft tissue mass; WK12, week 12.
