
FIGURE 1.
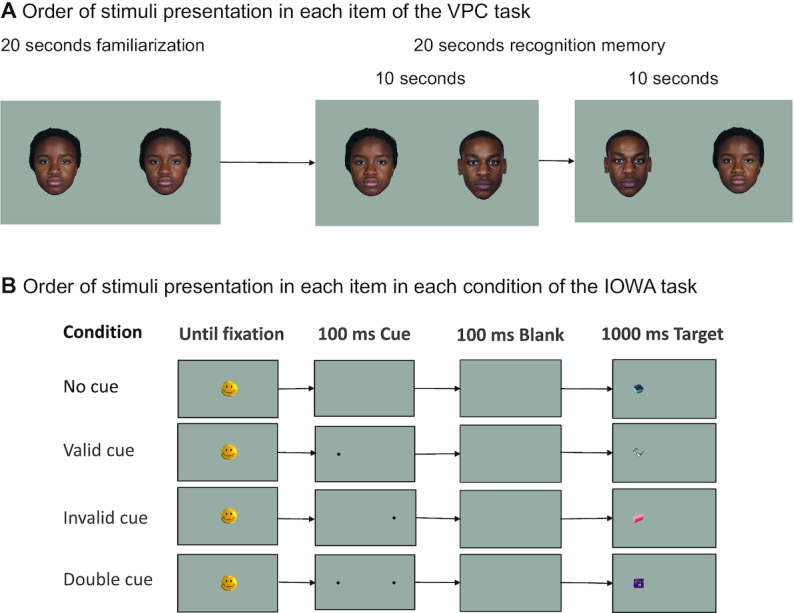
Order of stimuli presentation in the VPC task (panel A) and in each condition of the IOWA task (panel B). All images were presented on a gray background (RGB: 136, 136, 136). In the IOWA task, spatial cues and targets appeared 11° 45’ to the left or right of the central image. The visual attentional cue was a small black circle (0° 56’ diameter). Images were 4° 27’ (w) by 4° 7’ (h) of visual angle. IOWA, Infant Orienting with Attention; ms, milliseconds; RGB, red, green, blue; VPC, visual paired comparison.