Fig. 2.
A (the uppermost panel). Representative SD-OCT images of C57BL/6J mice (a, b, c, and d), control fed GLAST-/- mice (e, f, g, and h), and GLAST-/- mice + AST (i, j, k, and l). Panels a, b, c, and d correspond to C57BL/6J mice at P36, P72, P106, and P148, respectively. Panels e, f, g, and h correspond to control fed GLAST-/- mice at P44, P80, P114, and P156, respectively. Panels i, j, k, and l correspond to GLAST-/- mice + AST at P50, P78, P106, and P150, respectively.
B (the second upper panel). Comparison of the GCC thickness at the final observation point observed by SD-OCT in C57BL/6J
mice (a), control fed GLAST-/- mice (b), and GLAST-/- mice + AST (c).
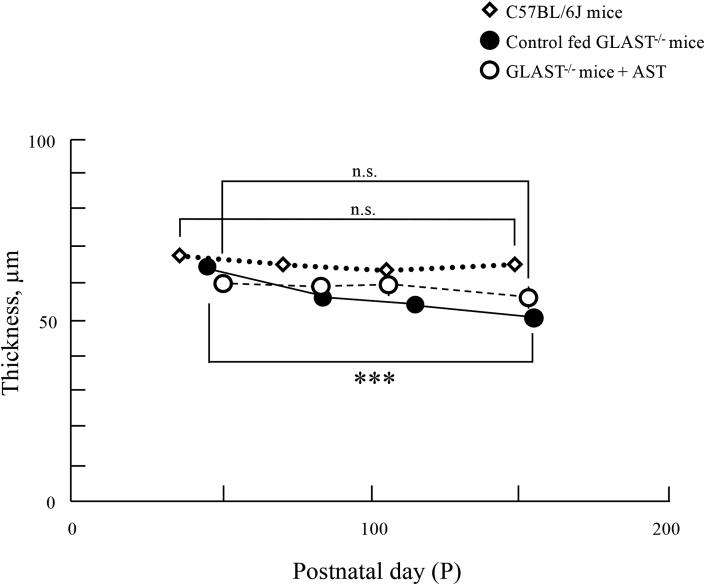
C (the third upper panel). The longitudinal changes in the thickness of the GCC. Diamonds, C57BL/6J
mice; closed circles, control fed GLAST-/- mice; open circles, GLAST-/- mice + AST. Animal numbers: C57BL6J mice, P36~P148 (n = 4); control fed GLAST-/-, P44~P114 (n = 4), p156 (n = 5); GLAST-/- mice + AST, P50 (n = 6), P78~P106 (n = 5), P150 (n = 4). Statistical significance: ***, P < 0.001 (Student's t-test). Bars indicate standard error
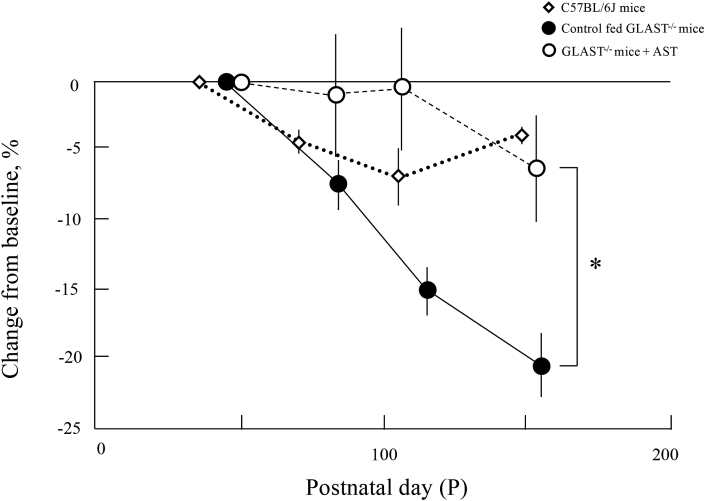
D (the bottom panel). Comparison of the change in the GCC thickness from the baseline to each observation points. Diamonds, C57BL/6J
mice; closed circles, control fed GLAST-/- mice; open circles, GLAST-/- mice + AST. Animal numbers: C57BL6J mice, P36~P148 (n = 4); control fed GLAST-/-, P44~P114 (n = 4), p156 (n = 5); GLAST-/- mice + AST, P50 (n = 6), P78~P106 (n = 5), P150 (n = 4). Statistical significance: *, P < 0.05 (Student's t-test). Bars indicate standard error.


