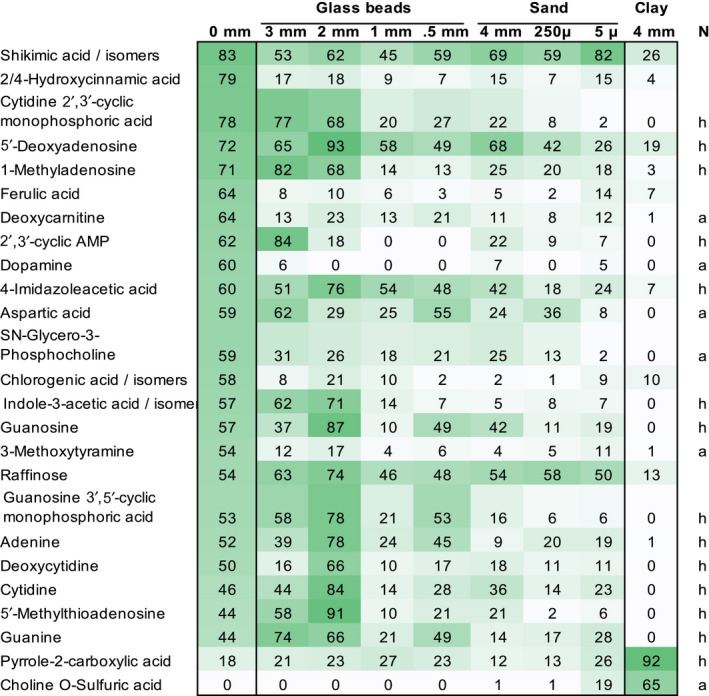
FIGURE 5.

Distinct metabolites of in situ clay Heatmap of metabolite abundances significantly different between exudates collected in situ from clay‐grown and hydroponically grown plants (black boxes). All substrates are displayed for comparison. Values indicate averaged peak heights, scaled to the maximum intensity for each compound. Metabolites are sorted in descending abundance for hydroponic exudates (0 mm). Data are means of 3 biological replicates, ANOVA, p = .05. Nitrogenous compounds are labeled as containing heterocyclic (h) or aliphatic (a) nitrogen. The full dataset is given in Table S1
