
Figure 6.
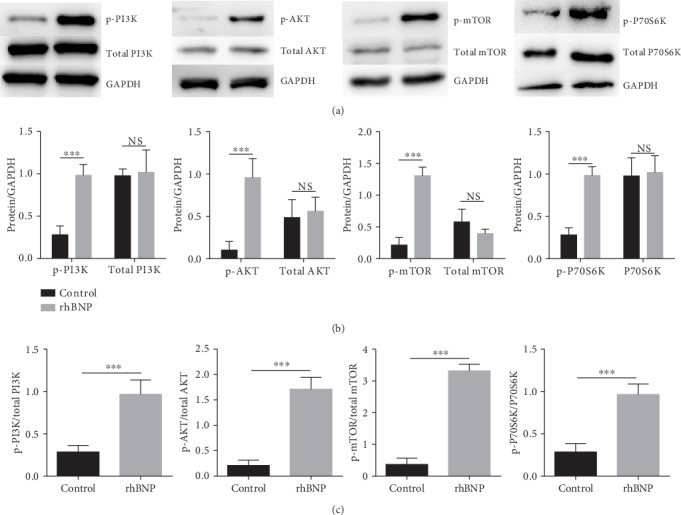
Effects of rhBNP on the PI3K/AKT/mTOR pathway in Jurkat T cell. (a) Western blot analysis for total and phosphorylated PI3K, AKT, mTOR, and P70S6K in cells. (b) Comparison of the expression level of total and phosphorylated PI3K, AKT, mTOR, and P70S6K. (c) Comparison of the activation level of these proteins in Jurkat T cells with/without rhBNP (0.1 μM) treatment. n = 3 per group, data are expressed as mean ± SD. ∗∗∗p < 0.01.