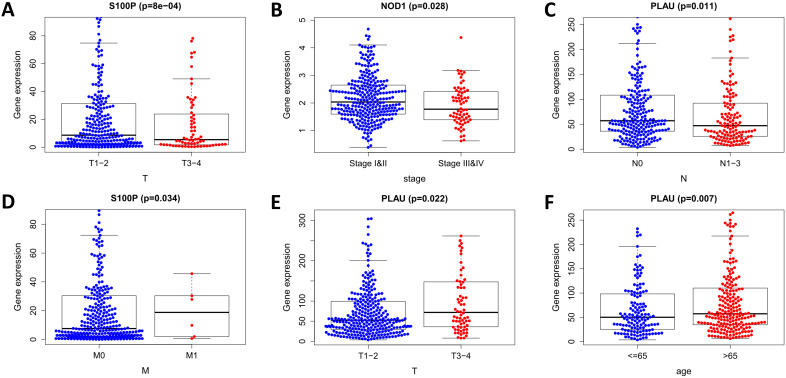
Figure 11.
Relationships of the variables in the model with the clinical characteristics of patients in the entire TCGA cohort. (A) S100P expression and T stage. (B) NOD1 expression and pathological stage. (C) PLAU expression and N stage. (D) S100P expression and M stage. (E) PLAU expression and T stage. (F) PLAU expression and age.

