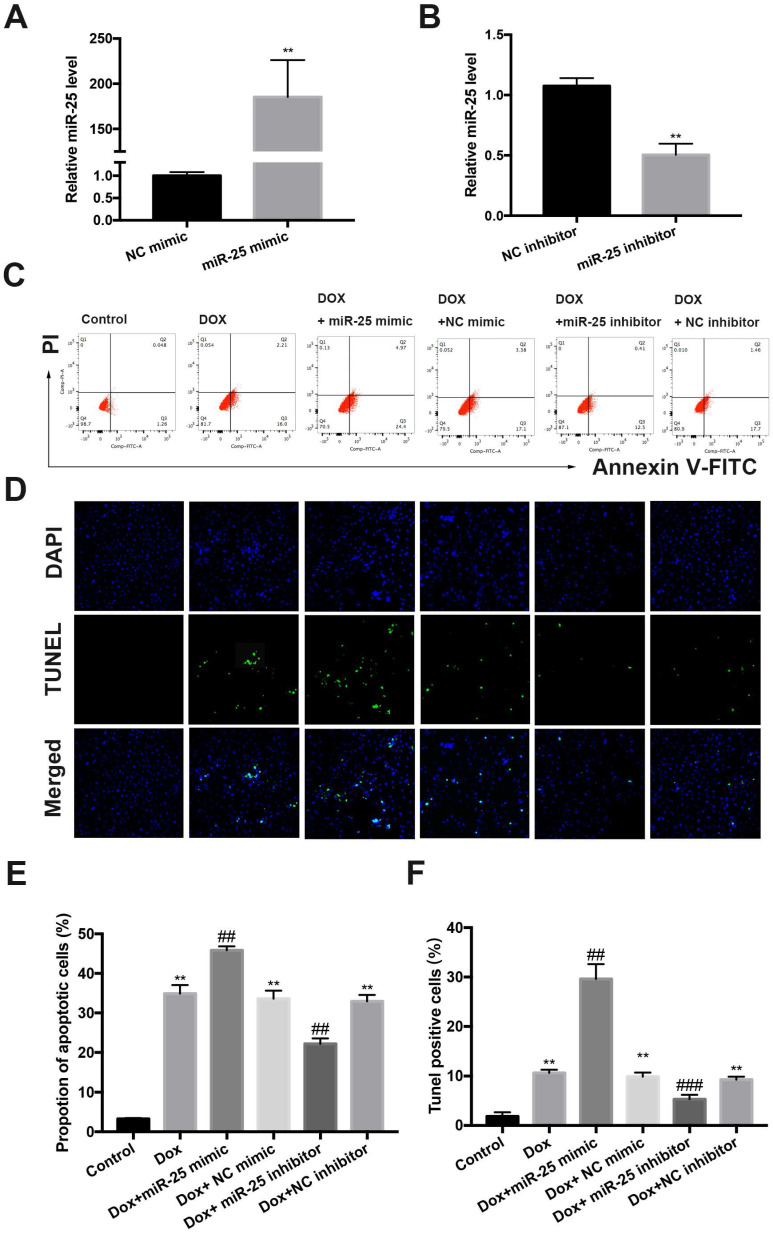
Figure 3.
The protective effect of miR-25 inhibition in DOX-induced apoptosis. The relative expression of miR-25 after transfection of miR-25 mimic(A) and miR-25 inhibitor(B) (**P < 0.01, n=4). (C) Representative dot plots of flow cytometric images in H9c2 cells after treated as indicated. (D)TUNEL assay results of different groups (original magnification ×400). Nuclei are stained in blue, and TUNEL staining is shown in green. Quantification of the results in C (E), and D (F). (*P < 0.05; **P < 0.01; ***P < 0.001 compared with control group; #p < 0.05; ##p < 0.01 compared with DOX+NC-treated group, n = 5)

