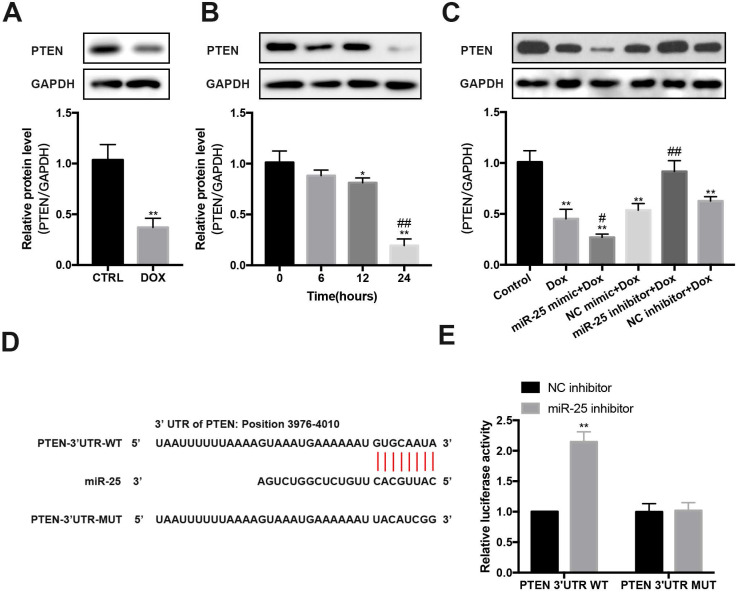
Figure 5.
miR-25 regulates the expression of PTEN. (A) Relative expression of PTEN measured from mice heart tissue lysates treated with DOX or CTRL. (B) After exposure to 5μM DOX for 6, 12, 24, 48h, PTEN levels were determined by Western blot analysis. (*P < 0.05; **P < 0.01 compared with cells in 0h; ##p < 0.01 compared with cells in 6h, n = 3) (C) After transfection of miR-25/NC mimic or miR-25/NC inhibitor, H9c2 cells were treated with 5μM DOX or control, and the PTEN expression was measured. GAPDH was served as the loading control. (*P < 0.05; **P < 0.01 compared with control group; #p < 0.05; ##p < 0.01 compared with DOX group, n = 3) (D) Sequence alignment of wild-type (WT) PTEN and mutated (MUT) PTEN mRNA 3′-UTR binding site of miR-25. (E) Luciferase activity levels upon co-transfection of a luciferase construct containing PTEN-3′UTR-WT or PTEN-3′UTR-MUT with miR-25 mimic or NC mimic in HEK293T cells. (**P < 0.01, n = 3)

