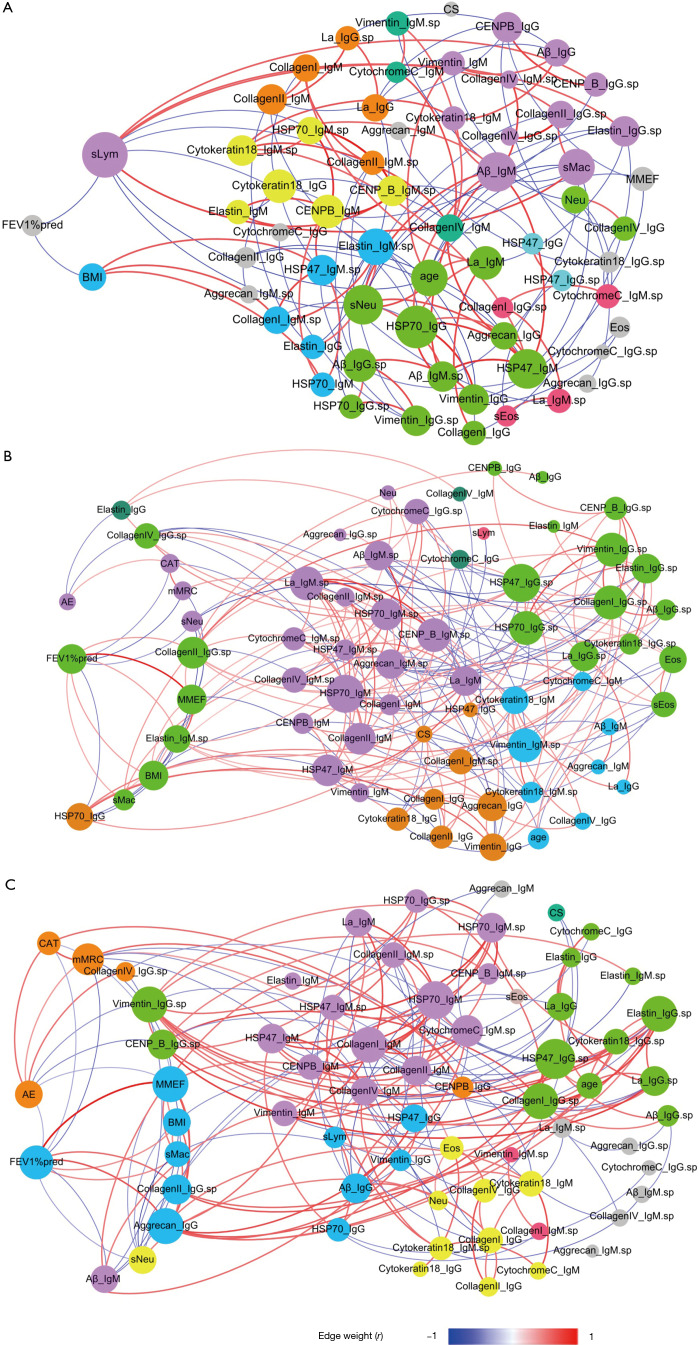
Figure 2.
Correlation networks of autoantibodies and clinical parameters. (A) Normal control; (B) eosinophilic COPD; (C) non-eosinophilic COPD. The networks were constructed by integrating clinical parameters and autoantibodies levels. Each node represents a clinical parameter or autoantibody. The size of each node is proportional to the sum of the edges connecting to it (degree value). Edges between two nodes represent a statistically significant correlation (P<0.05); edges with red color indicated statistically significant positive correlation, and edges with blue color indicated statistically significant negative correlation. The colour of each node represents the corresponding module. Modules containing only one node are all shown in gray. The suffix “sp” indicates autoantibodies in sputum; the other autoantibodies are those in serum. Aβ, amyloid-beta; HSP47, heat shock protein 47; HSP70, heat shock protein 70; La, La/Sjögren syndrome type B antigen; CENP-B, centromere protein B; Eos, blood eosinophil count; sEos, sputum eosinophil count; CS, current smoker; sMac, sputum macrophage count; Neu, blood neutrophil count; sNeu, sputum neutrophil count; sLym, sputum lymphocyte count; BMI, body mass index; FEV1, forced expiratory volume in 1 s; FEV1%pred, forced expiratory volume in 1 s in the percentage of predicted; CAT, chronic obstructive pulmonary disease assessment test; mMRC, modified Medical Research Council dyspnea scale; MMEF, maximal mid-expiratory flow. Summary: In these figures, we focused on two clinical parameters (FEV1%pred and prior exacerbations, shown on the left sides of the figures) and their correlated factors, including autoantibody levels and other clinical parameters. Distinct differences were found between the eosinophilic COPD and non-eosinophilic COPD groups in the correlated factors of FEV1%pred and prior exacerbations. In the eosinophilic COPD group (B), FEV1%pred was positively correlated (red lines) with the levels of two autoantibodies and was negatively correlated (blue lines) with the level of serum anti-HSP70_IgG. Prior exacerbations were positively correlated (red lines) with only the CAT score and were negatively correlated (blue lines) with the levels of two autoantibodies. In the non-eosinophilic COPD group (C), the FEV1%pred was positively correlated (red lines) with the levels of two autoantibodies and was negatively correlated (blue lines) with prior exacerbation and the level of serum anti-Aβ_IgM. Prior exacerbation was positively correlated (red lines) with the level of sputum anti-CollagenIV_IgG and was negatively correlated (blue lines) with lung function parameters and the levels of two autoantibodies.

