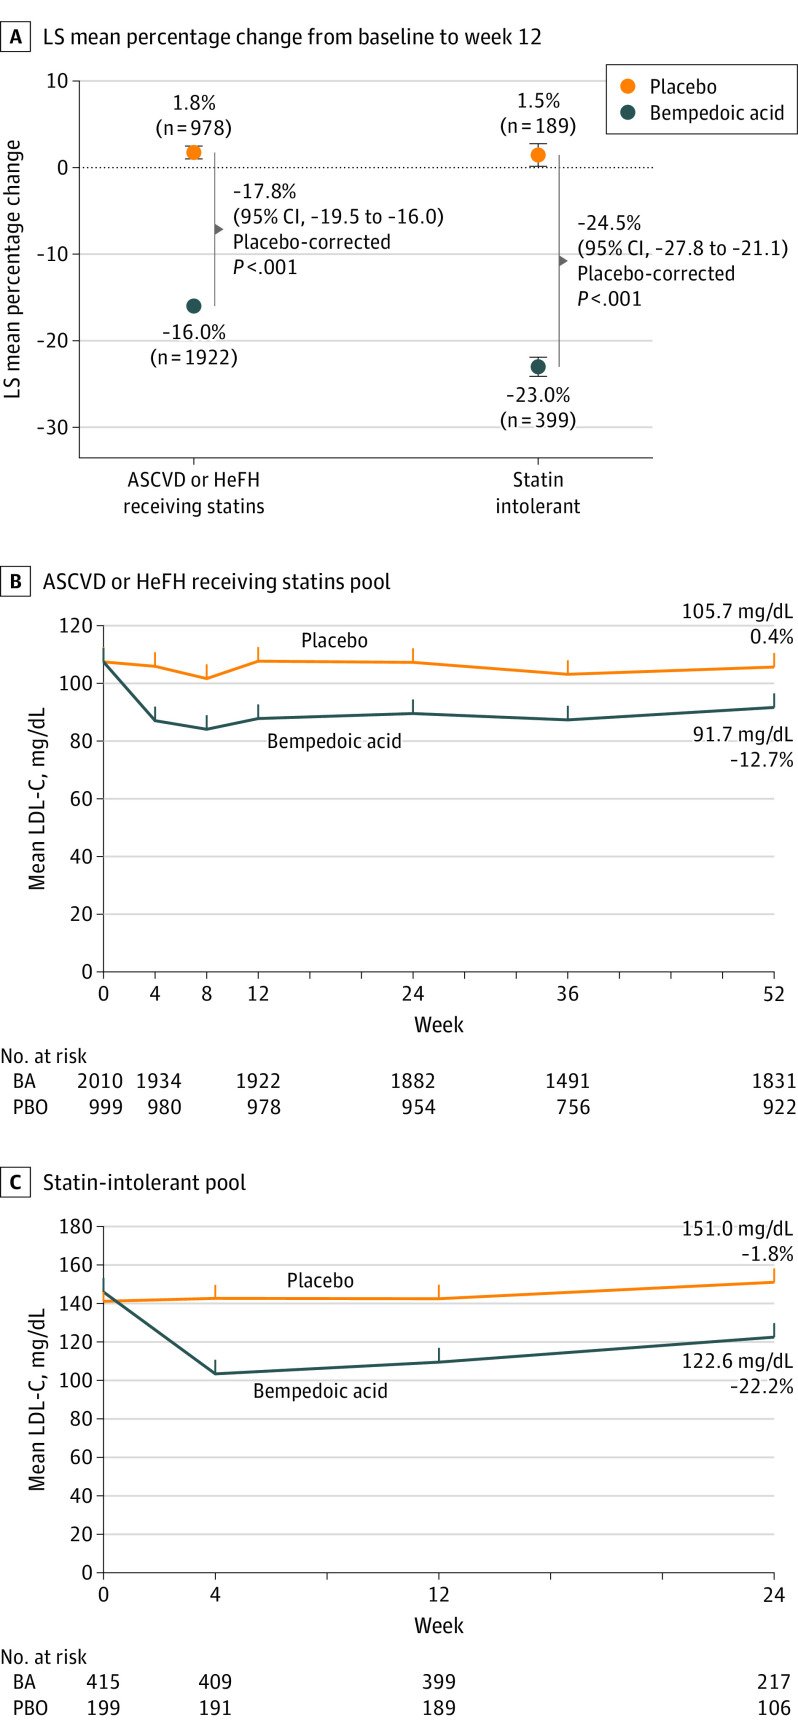
Figure 1. Changes in Low-Density Lipoprotein Cholesterol (LDL-C) Levels Associated With Bempedoic Acid Administration.
A, Percentage change from baseline in LDL-C levels at week 12. Data are least-squares (LS) mean (SE) values. The difference between placebo-corrected LS mean changes from baseline in LDL-C levels in the pool of patients with atherosclerotic cardiovascular disease (ASCVD) or heterozygous familial hypercholesterolemia (HeFH) or both receiving a maximally tolerated statin (−17.8%) and the pool of patients with statin intolerance (−24.5%) was significant (nominal P < .001). B and C, Mean LDL-C levels over time by treatment group. Data are observed mean (SE) values through week 52 in the pool of patients with ASCVD or HeFH or both receiving a maximally tolerated statin, and through week 24 in the pool of patients with statin intolerance. BA indicates bempedoic acid; PBO, placebo. To convert LDL-C to millimoles per liter, multiply by 0.0259.

