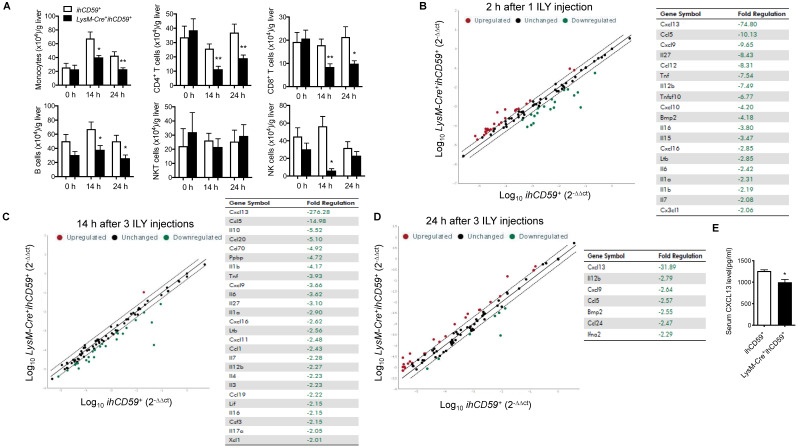
Figure 2.
Dynamic changes of immune cell infiltration, and cytokine & chemokine profile in the liver after the KC depletion in steady condition. (A) Numbers of infiltrating immune cells (monocytes, T cells, B cells, NKT cells and NK cells) in livers before ILY injection (0 h) or at 14 and 24 h after 3 ILY injections (100 ng/g, i.p. at 2 h intervals) to ihCD59+ and LysM-Cre+ihCD59+ mice (n=4 at 0 h and n=6 for all other time points). (B-D) RT2 Profiler PCR Array analysis of the hepatic cytokine and chemokine transcripts in the LysM-Cre+ihCD59+ and ihCD59+ mice at 2 h after 1 ILY injection (B, 100 ng/g, i.p., n = 2), and at 14 h (C) and 24 h (D) after 3 ILY injections (100 ng/g, i.p. at 2 h intervals, n = 2 for each time point). Scatter plot represents the relative transcript levels for each gene obtained from LysM-Cre+ihCD59+ mice plotted against the same gene from ihCD59+ mice. Genes with fold changes >2.0 are shown in the table on the right. (E) ELISA analysis of CXCL13 in serum collected from ihCD59+ and LysM-Cre+ihCD59+ mice (n = 3) at 8 h after 3 ILY injections (100 ng/g, i.p. at 2 h intervals). Data are shown as mean ± SEM. * P<0.05; ** P<0.01, as determined by unpaired two-tailed Student's t-test.

