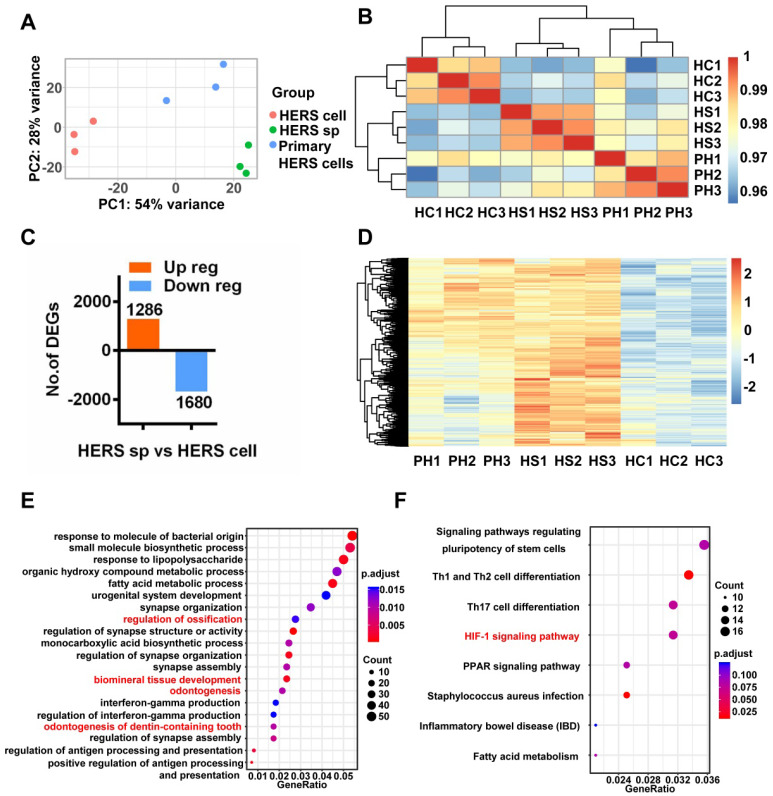
Figure 5.
RNA-seq was applied to investigate mechanisms. (A) Principal component analysis (PCA) revealed the variance among each group and indicated that HERS spheroids were similar to HERS primary cells. (B) The correlation heatmap results were consistent with PCA and showed that there was better homogeneity within the HERS spheroids groups. (C) Among the 2966 differentially expressed genes (DEGs) between HERS spheroids and 2D monolayer HERS cells, 1286 genes were up-regulated and 1680 genes were down-regulated. (D) Heatmap presenting the up-regulated DEGs between HERS spheroids and 2D monolayer HERS cells. (E) Gene ontology (GO) analysis of the up-regulated genes revealed 4 of the top 20 enriched biological processes were odontogenesis-related, consistent with results indicating that HERS spheroids maintained cementegenesis potential. (F) KEGG enrichment analysis presented several pathways highly related to stem cell traits. HC: 2D monolayer HERS cells; HS: HERS spheroids; PH: Primary HERS cells.

