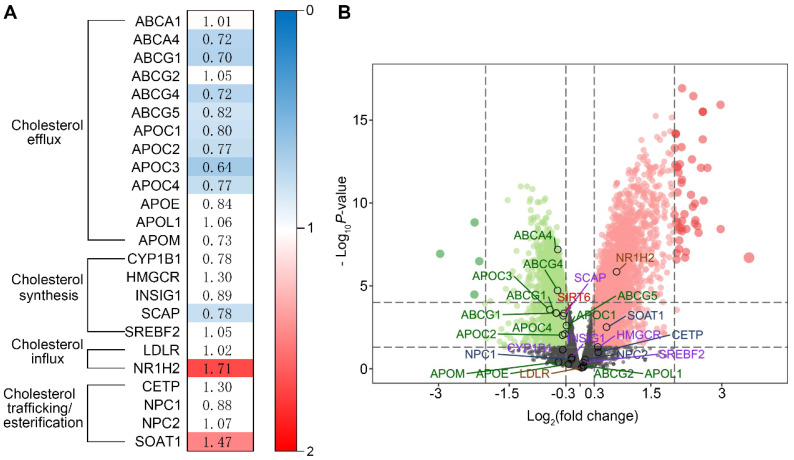
Figure 1.
Bioinformatics analysis of genes that regulate cholesterol homeostasis in patients with HN using the GSE37460 gene expression dataset. (A) Fold change in glomerular gene expression in patients with HN compared with healthy controls. Blue blocks represent downregulated differentially expressed genes (DEGs), false discovery rate ≤0.05; red blocks represent upregulated DEGs, false discovery rate ≤0.05; white blocks represent DEGs with no statistical significance, false discovery rate ≥0.05. (B) Volcano plot of the DEGs (red and green indicate DEGs with a |log2 fold-change| >0.3 and false discovery rate <0.05. Black indicates no DEGs or DEGs with a false discovery rate ≥0.05).

