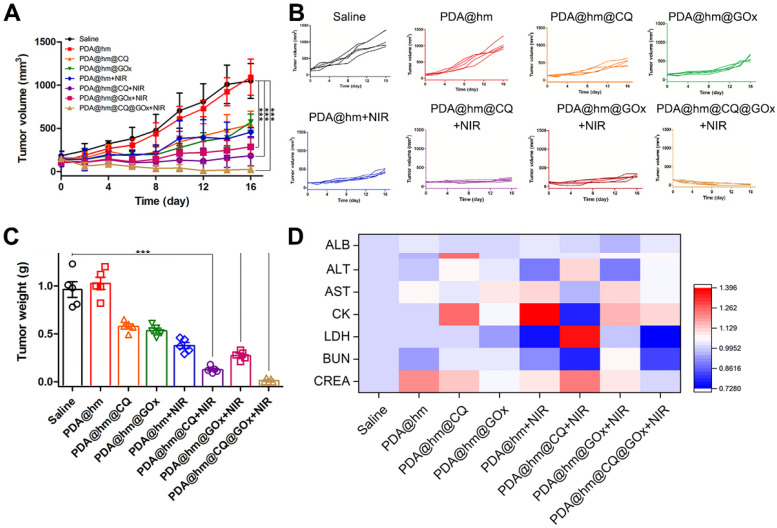
Figure 7.
(A) Tumor growth curves of mice after various treatments in 16 days. (B) Individual tumor growth curves of the mice. (C) The average tumor weights after various treatments for 16 days. (D) Blood analysis of mice at 16 days after various treatments with heat map compared with the saline-treated mice. ***p < 0.001 versus the control group.

