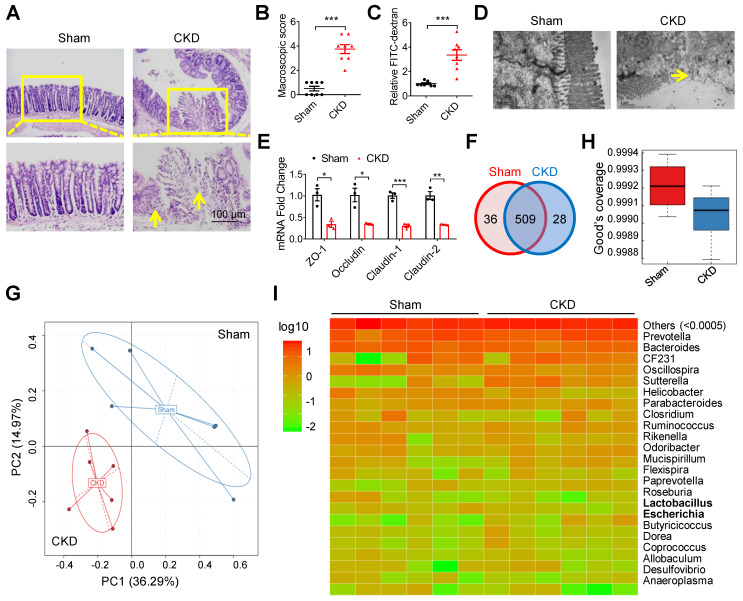
Figure 1.
Intestinal barrier injury and dysbacteriosis were observed in CKD mice. (A-E) CKD mouse model was constructed, taking sham mice as control. n=8 per group. HE staining (A), macroscopic injury score (B, detailed information was shown in Table S5), intestinal permeability (C), transmission electron microscopy (TEM) observation of tight junction (D) and qPCR analysis of tight junction-related genes (E) of intestinal tissues from sham and CKD mice. Yellow arrow indicates intestinal mucosal damage in (A) and impaired tight junction in (D). (F-I) Fresh fecal samples of sham and CKD mice were collected for 16s ribosomal RNA (rRNA) sequencing and analysis. n=6 per group. Venn analysis (F), principal component analysis (G), alpha diversity comparison (H) and heatmap analysis (I) between sham and CKD mice. Data are shown as mean ± SEM and were analyzed by two-tailed unpaired Student's t test (B, C, E). * P<0.05, ** P<0.01, *** P<0.001.

