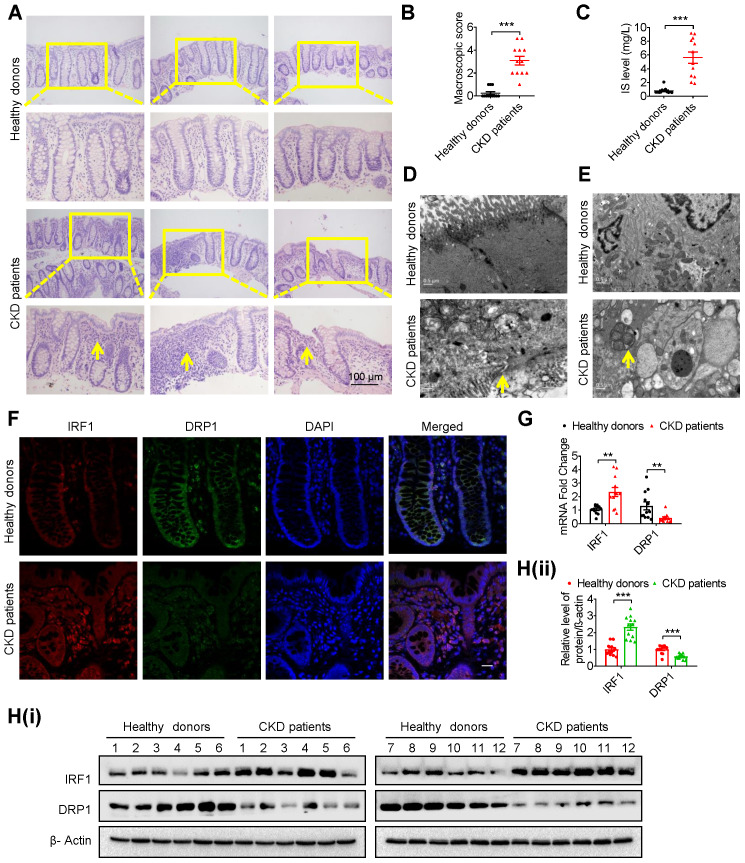
Figure 7.
Intestinal barrier injury, disruption of the IRF1-DRP1 axis and mitophagic impairment were observed in intestinal tissues of CKD patients. (A, B) HE staining (A) and macroscopic injury score (B, detailed information was shown in Table S5) of intestinal tissues from healthy donors and CKD patients at stage 5. n=12 per group. Scale bar, 100 μm. (C) Serum IS level of (A) was determined using HPLC. (D, E) TEM observation of tight junction (D) and mitophagy (E) in intestinal tissues from (A). (F-H) The expressions of IRF1 and DRP1 in intestinal tissues from (A) were detected using immunofluorescence (F), qPCR (G) and Western blot analysis (H). Scale bar, 10 μm. The gray scale of bands was quantified with ImageJ software. Yellow arrow indicates intestinal mucosal damage in (A), impaired tight junction in (D) and mitophagic vacuoles in (E). Data are shown as mean ± SEM and were analyzed by two-tailed unpaired Student's t test (B, C, G, H). ** P<0.01, *** P<0.001.

