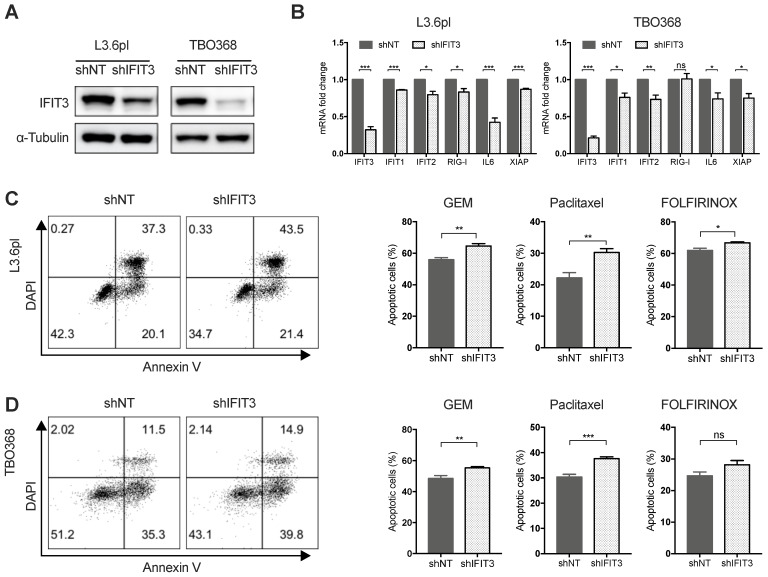
Figure 3.
IFIT3 renders chemotherapy resistance in PDAC cells. (A) IFIT3 knockdown was confirmed with western blot in both L3.6pl and TBO368 cells. Membrane was stripped after IFIT3 detection and re-probed with α-Tubulin. (B) IFN pathway and NF-κB pathway targeted genes, IFIT1, IFIT2, RIG-I, IL6, and XIAP were significantly down-regulated after knockdown of IFIT3. (C-D) Knockdown of IFIT3 increased sensitivity of L3.6pl (C) and TBO368 (D) to chemotherapy. Cells were treated with gemcitabine (3 ng/ml for L3.6pl and 400 ng/ml for TBO368), paclitaxel (10 nM) or FOLFIRINOX (Oxaliplatin: Irinotecan: Folinic acid Calcium: 5-Fluorouracil=1:2:4:25 µM as 1X, used as 0.025X for L3.6pl and 0.5X for TBO368) for indicated time. Apoptosis was determined by flow cytometry analysis of Annexin V/DAPI staining. Representative FACS dot plots are shown on the left. Bar graphs are presented as mean ± SEM of three independent experiments. *p < 0.05, **p < 0.01, ***p < 0.001, ns: non-significant, p > 0.05.

