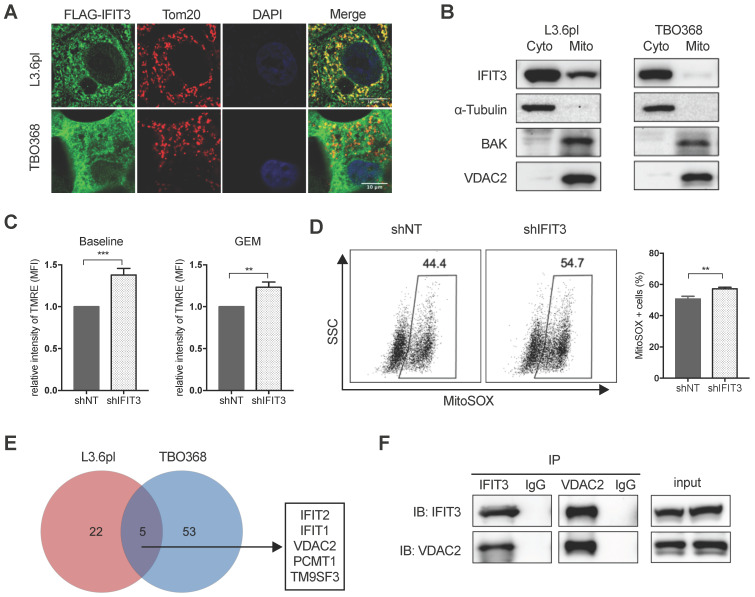
Figure 4.
IFIT3 regulates mitochondria-associated apoptosis. (A) Confocal immunofluorescence labeled with anti-FLAG (green), anti-Tom20 (red), and counterstained with DAPI (blue), showed co-localization of FLAG-tagged IFIT3 and Tom20 in mitochondria. L3.6pl and TBO368 cells stably express FLAG-tagged IFIT3 were used here. Scale was shown in the lower-right corner. (B) Western blot showed localization of IFIT3 in cytosol and mitochondria of L3.6pl and TBO368. Mitochondria were isolated as indicated in methods section. Cyto represent cytosol and Mito represent mitochondria. We probed α-Tubulin as cytosolic marker, BAK and VDAC2 as mitochondrial marker. (C) IFIT3 knockdown in L3.6pl altered mitochondrial membrane potential (ΔΨm) with or without gemcitabine treatment. TMRE was used to determine the mitochondrial membrane potential (ΔΨm). MFI: mean fluorescence intensity. (D) IFIT3 knockdown in L3.6pl showed more MitoSOX positive cells when treated with gemcitabine. Representative FACS dot plot and bar graph are shown. (E) Mass spectrometry results of immunoprecipitated samples by anti-IFIT3 antibody are shown in Venn diagram. Cells were treated with gemcitabine for indicated time before harvest. Proteins with p < 0.01 and log2 difference > 1 are considered significant. Proteins identified in the intersection of L3.6pl and TBO368 are listed beside the diagram. (F) Interaction between IFIT3 and VDAC2 was confirmed with western blot in L3.6pl. Data are presented as mean ± SEM of three independent experiments. **p < 0.01, ***p < 0.001.

