Figure 2.
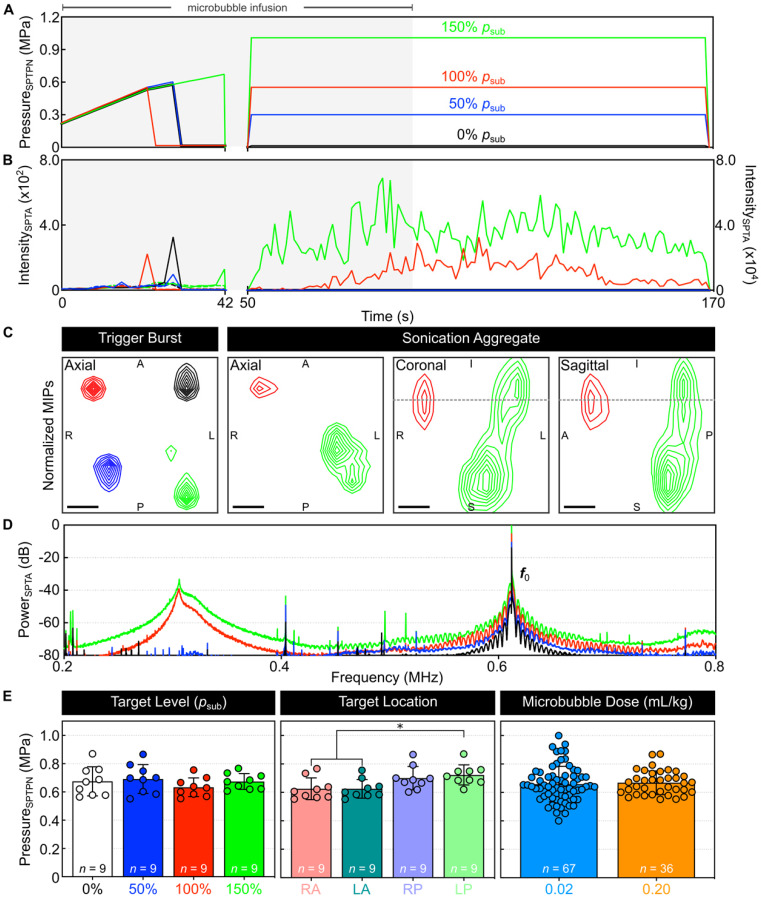
Multi-point 3D subharmonic imaging calibration in vivo. (A) Estimated in-situ SPTPN pressure and (B) SPTA source field intensity as a function of time during a four-point sonication (0%, 50%, 100%, and 150% psub target levels) with microbubbles in circulation (rabbit #3, mean target location = [-4,0,-31] mm in array coordinates). Data is shown from both the calibration (time = 0-42 s, τ = 3 ms) and fixed-pressure (time = 50-169 s, τ = 10 ms) sonication stages. The microbubble infusion window (time = 0-90 s) is indicated by the shaded regions. Color-coded dashed lines in (B) represent SPTA source field intensity data from the corresponding baseline sonication without microbubbles in circulation. (C) Maximum intensity projection (MIP) contour images of ultrafast 3D PCI data (τ = 100 µs) for the burst during which spatially-coherent subharmonic activity was detected for each grid point during calibration ('trigger burst', data from each grid point is self-normalized), as well as for sonication-aggregate data (each grid point normalized to the 150% psub target level data). Linear contours are displayed at 10% intervals starting at 20%. The dotted gray lines overlaid on the coronal and sagittal MIPs for the sonication-aggregate data indicate the superior-inferior coordinate of the axial target plane. Scale bars indicate 2 mm. (D) Sonication-averaged power spectrum of the unfiltered beamformed signal at the location of SPTA source field intensity for each target level, normalized to the power spectral density at the transmit frequency (f0 = 612 kHz) in the 150% psub target level data and plotted on a decibel scale. (E) In-vivo SPTPN pressure subharmonic threshold values (cohort #1) stratified based on target level, target location, and microbubble dose. The number of samples per group is indicated by n, and * denotes a statistically significant difference between groups (p < 0.05). Error bars represent one SD.

