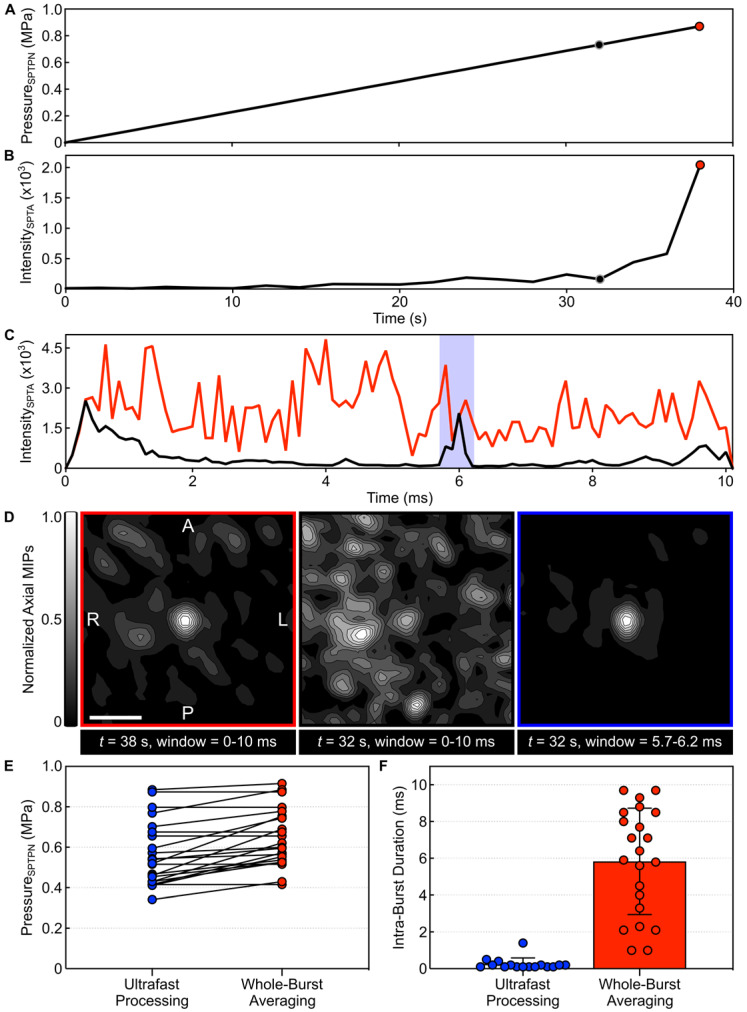
Figure 3.
Ultrafast 3D acoustic imaging uncovers spatiotemporal microbubble dynamics in vivo. (A) Estimated in-situ SPTPN pressure and (B) SPTA source field intensity (τ = 10 ms) as a function of time during a single-point calibration sonication with microbubbles in circulation (rabbit #10, target location = [-5,1,-9] mm in array coordinates). (C) SPTA source field intensity as a function of time throughout the 10 ms burst length for the bursts 32 s (SPTPN pressure = 0.73 MPa) and 38 s (SPTPN pressure = 0.87 MPa) into the sonication (τ = 100 µs). (D) Normalized axial MIP contour images of 3D PCI data for the bursts 32 s and 38 s into the sonication generated via whole-burst temporal averaging (τ = 10 ms), and for the burst 32 s into the sonication with a 500 μs beamforming window denoted by the shaded blue region in (C). The axial imaging FOV is centered on the target location. Scale bar indicates 5 mm. (E) In-vivo SPTPN pressure subharmonic threshold values (cohort #2) obtained retrospectively via ultrafast processing (τ = 100 µs) and intraoperatively via whole-burst temporal averaging (τ = 10 ms). (F) Intra-burst microbubble activity duration within the first burst of the calibration sonication in which subharmonic activity is detected using both ultrafast processing (τ = 100 µs) and whole-burst temporal averaging (τ = 10 ms). Data in (E,F) corresponds to a total of 22 calibration sonications across all 8 animals in cohort #2.

