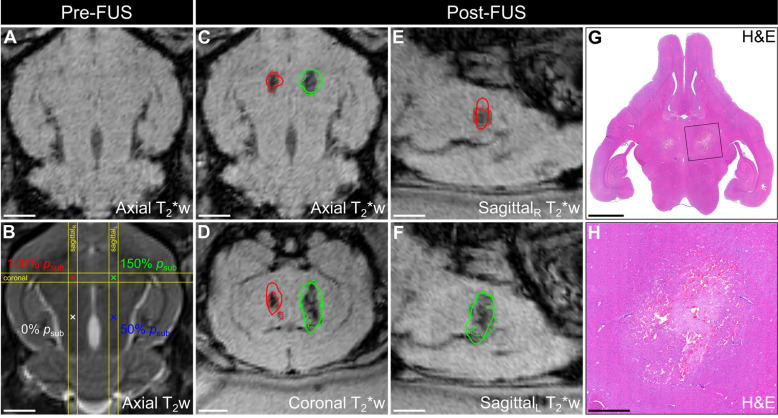
Figure 4.
Spatial correlation of ultrafast 3D microbubble imaging data with volumetric FUS-induced brain tissue damage. Axial (A) T2*w and (B) T2w MRI data acquired pre-sonication (rabbit #5, mean target location = [1,8,-23] mm in array coordinates, point spacing = 6 mm). Color-coded target locations and corresponding target levels are overlaid in (B). (C) Axial, (D) coronal, and (E,F) sagittal T2*w MRI data acquired immediately post-sonication. The coronal and sagittal slice volumes are indicated in (B) by the yellow lines. Segmented regions of T2*w MRI signal hypointensity induced by the exposures (dotted lines) and corresponding sonication-aggregate ultrafast PCI contour data at the operating threshold that maximizes the global PR curve F1-score of the MRI3D dataset (solid lines) are overlaid and are color-coded by target level (green = 150% psub, red = 100% psub, blue = 50% psub, black = 0% psub). Scale bars on the MRI data indicate 5 mm. (G) Axial H&E stained tissue section corresponding to the axial MRI plane (sacrifice time point = 48 h post-sonication). (H) Magnified view of the left-anterior grid point (150% psub target level). Scale bars on the H&E data in (G) and (H) indicate 5 mm and 1 mm, respectively.

