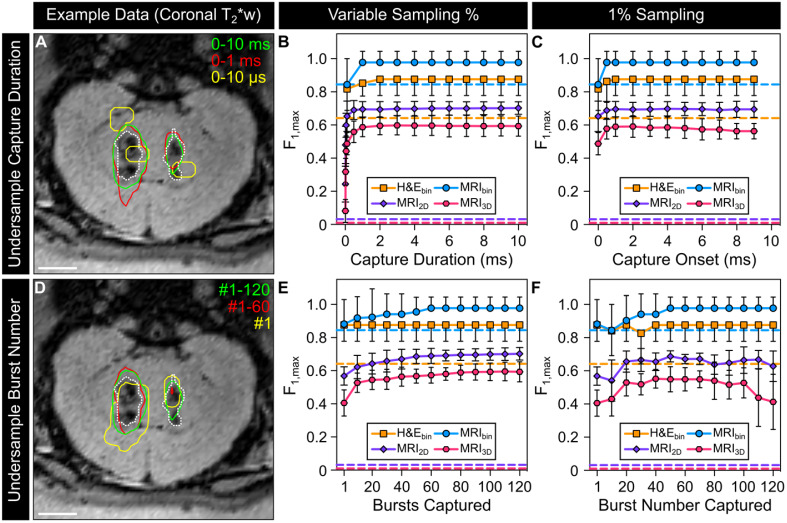
Figure 6.
Effects of undersampling acoustic emissions on the predictive capability of microbubble imaging data. (A) Example of undersampling the 10 ms burst length (capture duration per burst < 10 ms, number of bursts captured = 120). Sonication-aggregate ultrafast PCI contour data at the operating threshold that maximizes the global PR curve F1-score of the MRI3D dataset are overlaid (solid lines) and are color-coded by capture window (green = 0-10 ms, red = 0-1 ms, yellow = 0-10 µs). (B) Maximum F1-score (F1,max) as a function of the capture duration per burst (capture onset time = start of 10 ms burst). (C) F1,max as a function of the capture onset time within the 10 ms burst (capture duration = 100 µs). (D) Example of undersampling the 120 burst exposure duration (number of bursts captured < 120, capture duration per burst = 10 ms). Sonication-aggregate ultrafast PCI data at the operating threshold that maximizes the global PR curve F1-score of the MRI3D dataset are overlaid (solid lines) and are color-coded by the burst numbers captured (green = #1-120, red = #1-60, yellow = #1). (E) F1,max as a function of the number of bursts captured (capture onset time = start of 120 burst exposure). (F) F1,max as a function of the single burst captured within the 120 burst exposure. In (B,C,E,F) animal-wise F1-scores (mean ± SD) are provided for binary classification of tissue damage on both MRI (MRIbin) and H&E (H&Ebin), as well as 2D pixel-wise (MRI2D) and 3D voxel-wise (MRI3D) classification of tissue damage on MRI. F1-scores were calculated independently for each animal using the operating threshold that maximizes the global PR curve F1-score. The color-coded dashed lines denote the F1-score of classifiers with random performance for each dataset. One-way error bars are plotted for the binary classification data for visualization purposes. In (A,D) the coronal imaging plane intersecting the 100% psub (target location = [-6,8,-21] mm in array coordinates) and 150% psub (target location = [0,8,-21] mm in array coordinates) targets is shown and segmented regions of T2*w MRI signal hypointensity induced by the exposures are overlaid (dotted white lines, rabbit #2). Scale bars indicate 5 mm.

