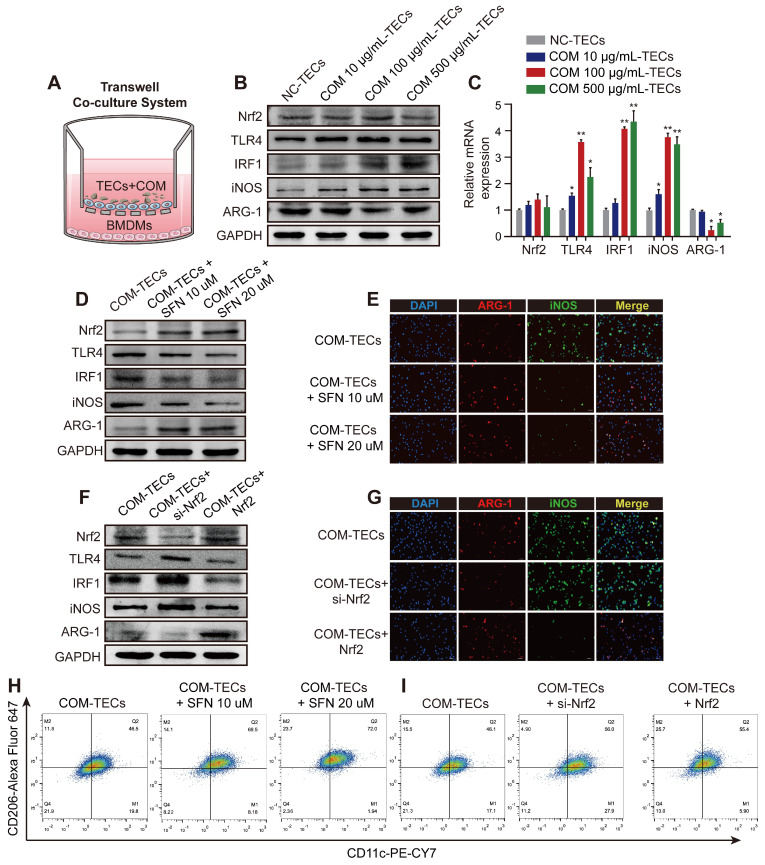
Figure 3.
Nrf2 suppresses TLR4 and IRF1 levels and promotes M2Mϕ polarization in vitro. (A) BMDM and COM-TECs coculture schematic diagram. Western blot (B) and qPCR (C) analyses of Nrf2, TLR4, IRF1, iNOS, and ARG-1 levels in BMDMs co-cultured with increasing COM dose stimulated TECs. GAPDH was used as an internal control. (D, F) Western blot detection of Nrf2, TLR4, IRF1, iNOS, and ARG-1 levels following SFN treatment or Nrf2 upregulation/downregulation in BMDMs co-cultured with COM-stimulated TECs. GAPDH was used as an internal control. (E, G) The distribution of iNOS (green) and ARG-1 (red) in BMDMs according to immunofluorescence. (H, I) Flow cytometric analysis of the polarization state of BMDMs using anti-CD11c and anti-CD206 in F4/80+ and CD11b+ cells. The data are shown as the mean ± standard error (SE) of three independent experiments. *P < 0.05; **P < 0.01, as determined by Student's t test (C) or one-way ANOVA (E, G, H, I).

